- Gold prices fail to extend the latest pullback beyond 200-bar SMA.
- 50% Fibonacci retracement and the channel’s upper line add to the resistances.
- Late-November top, channel’s lower line keep declines in check.
Gold prices again step back from 200-bar Simple Moving Average (SMA) while declining to $1,475.60 ahead of Friday’s European session. The yellow metal also follows a one-month-old rising channel formation.
With this, the quote is likely to retest 38.2% Fibonacci retracement of November month drop, at $1,472.30 whereas late-November high around $1,466.60 and the channel’s support close to $1,456.30 could question sellers next.
If prices keep trading southwards below $1,456, the previous month low near $1,445 will return to the chart.
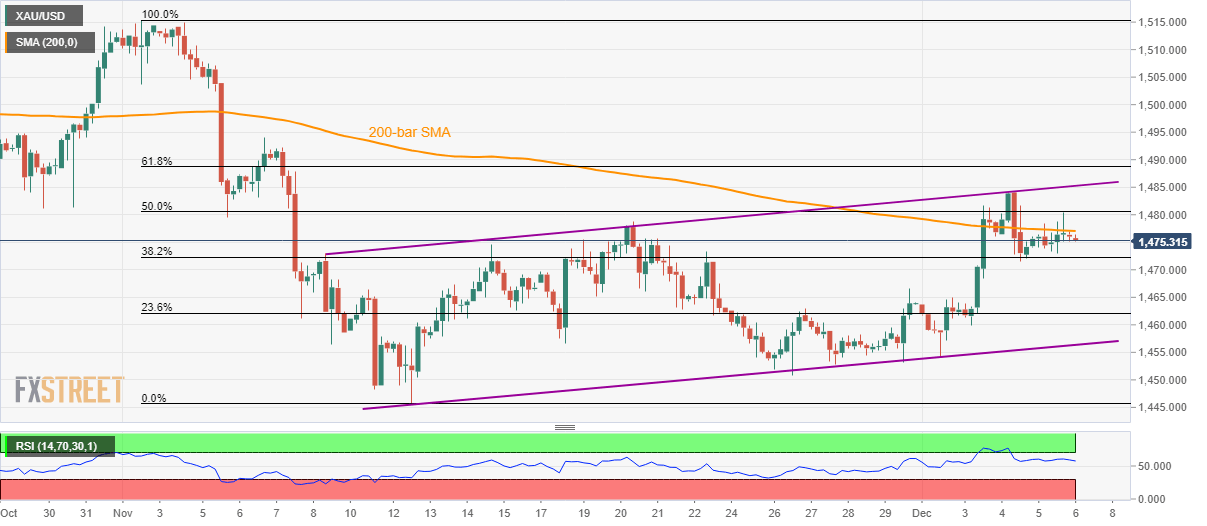
Meanwhile, a 50% Fibonacci retracement level of $1,480.50 acts as intermediate halt during the Bullion’s rise from 200-bar SMA, at $1,477 now, to the channel’s resistance close to $1,485.
Given the quote’s rally beyond $1,485, 61.8% Fibonacci retracement level of $1,488.75 and November 06 high around $1,494 could become buyers’ favorite.
Gold four-hour chart
Trend: Pullback expected
