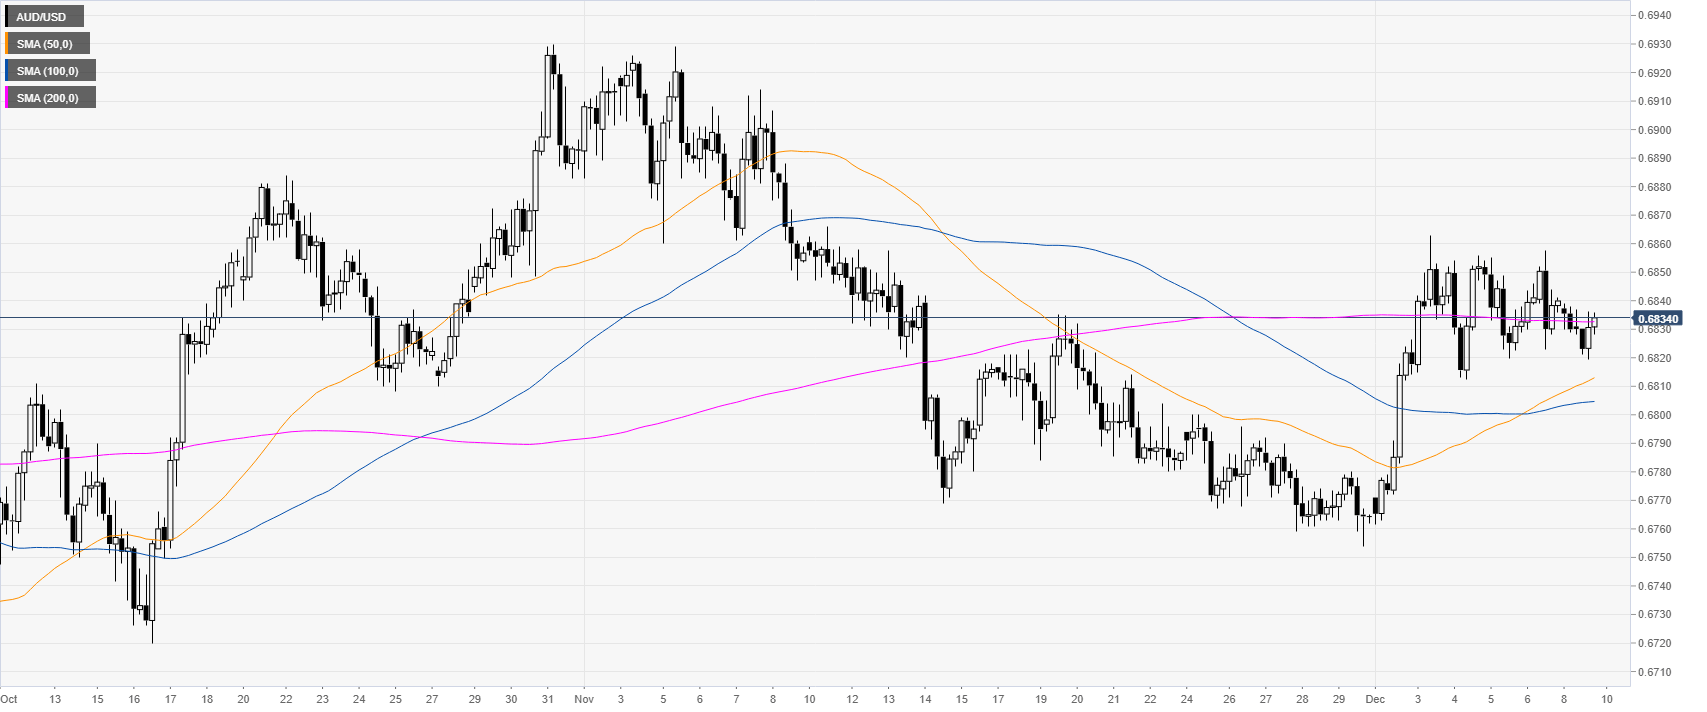
- AUD/USD is trading sideways coiling around the 200 DMA.
- The market is challenging the 0.6836/43 resistance zone.
AUD/USD daily chart
After the initial bullish breakout at the start of December, AUD/USD is remaining in range near the 200-day simple moving average (DMA).
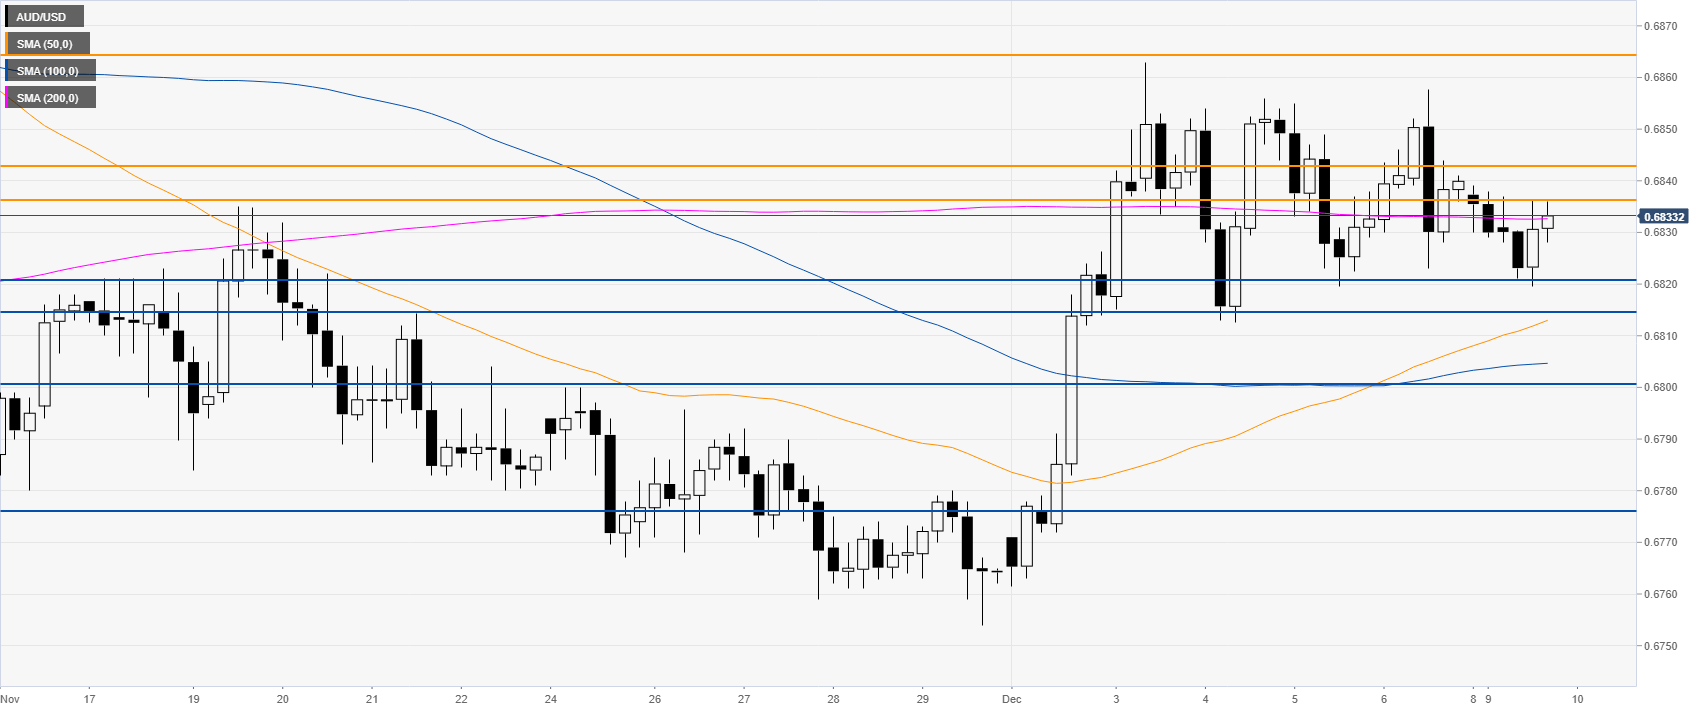
AUD/USD four-hour chart
The aussie is challenging the 0.6836/43 resistance zone and the 200 SMA. If the market breaks this area, the buyers could take the lead and drive the market to the 0.6864 level in the medium term, according to the Technical Confluences Indicator.
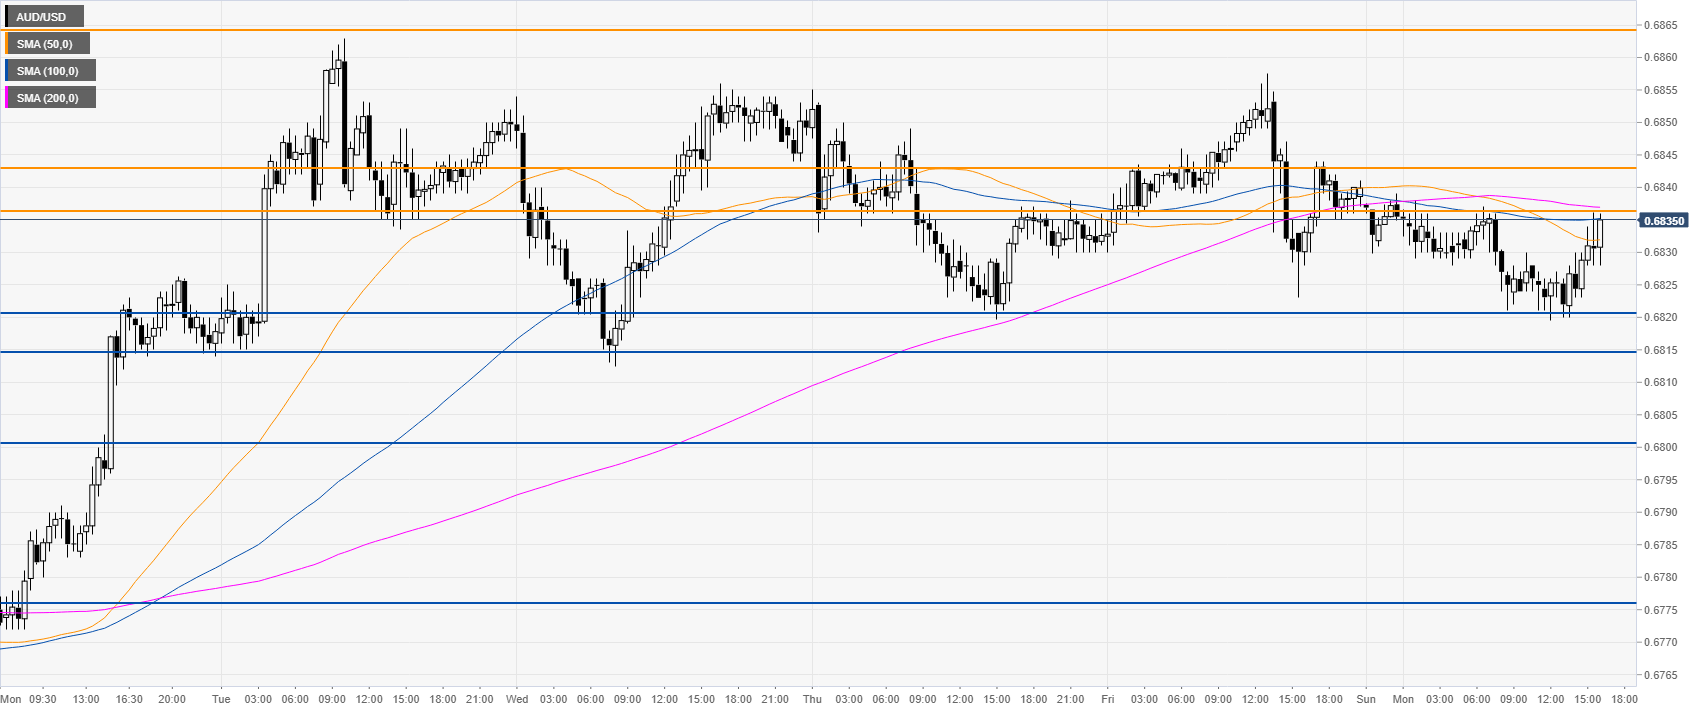
AUD/USD 30-minute chart
AUD/USD is trading below the 200 SMA, suggesting a bearish momentum in the near term. However, a breakdown below the 0.6821/14 support zone could lead to 0.6800, 0.6779 and 0.6775 price levels.
Additional key levels
