- GBP/JPY stays positive around seven months’ high.
- 200-week SMA, multi-month-old resistance line limit the pair’s upside.
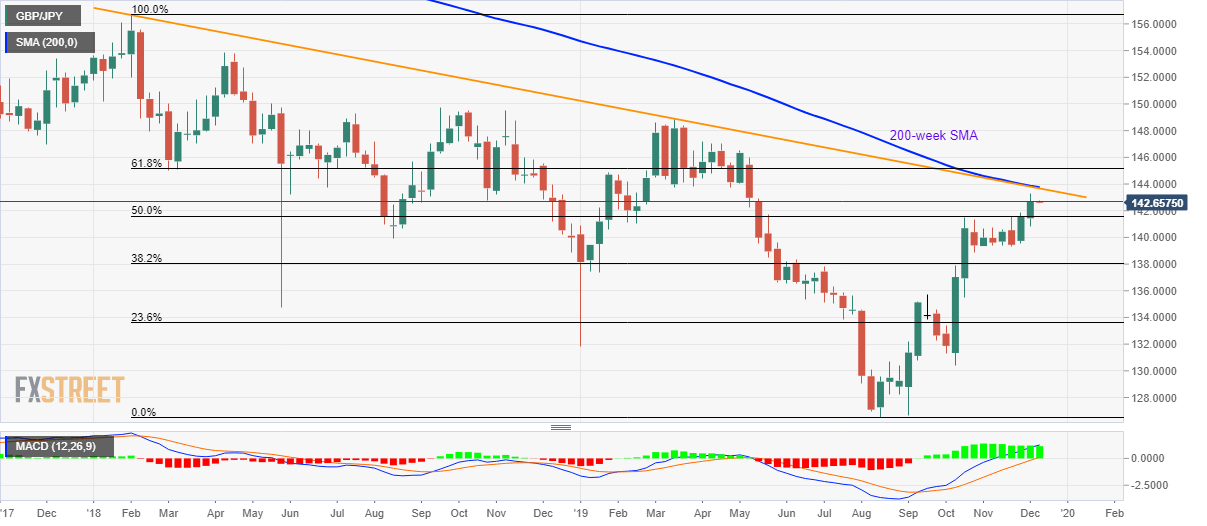
- 50% of Fibonacci retracement acts as immediate key support.
GBP/JPY takes the bids to 142.70 during Monday’s Asian session. The pair extends the late Friday’s recovery while running towards the recent highs surrounding 143.30.
Even so, 200-week Simple Moving Average (SMA) and a downward sloping trend line since February 2018 could keep buyers in check near 143.65/80. Should bulls clear 143.80, 61.8% Fibonacci retracement level of 2018 peak to June 2019 trough, around 145.15/20, will be their next target.
It’s worth mentioning that pair’s run-up beyond 145.20 enables it to take aim at the year 2019 top near 148.90.
Alternatively, a weekly closing below 50% Fibonacci retracement level of 141.58 can trigger fresh pullback towards 1400.00 and then the late-October bottom close to 138.50.
GBP/JPY weekly chart
Trend: Pullback expected
