- DXY is starting the week by consolidating last Friday’s spike up.
- The level to beat for buyers is the 97.85 resistance.
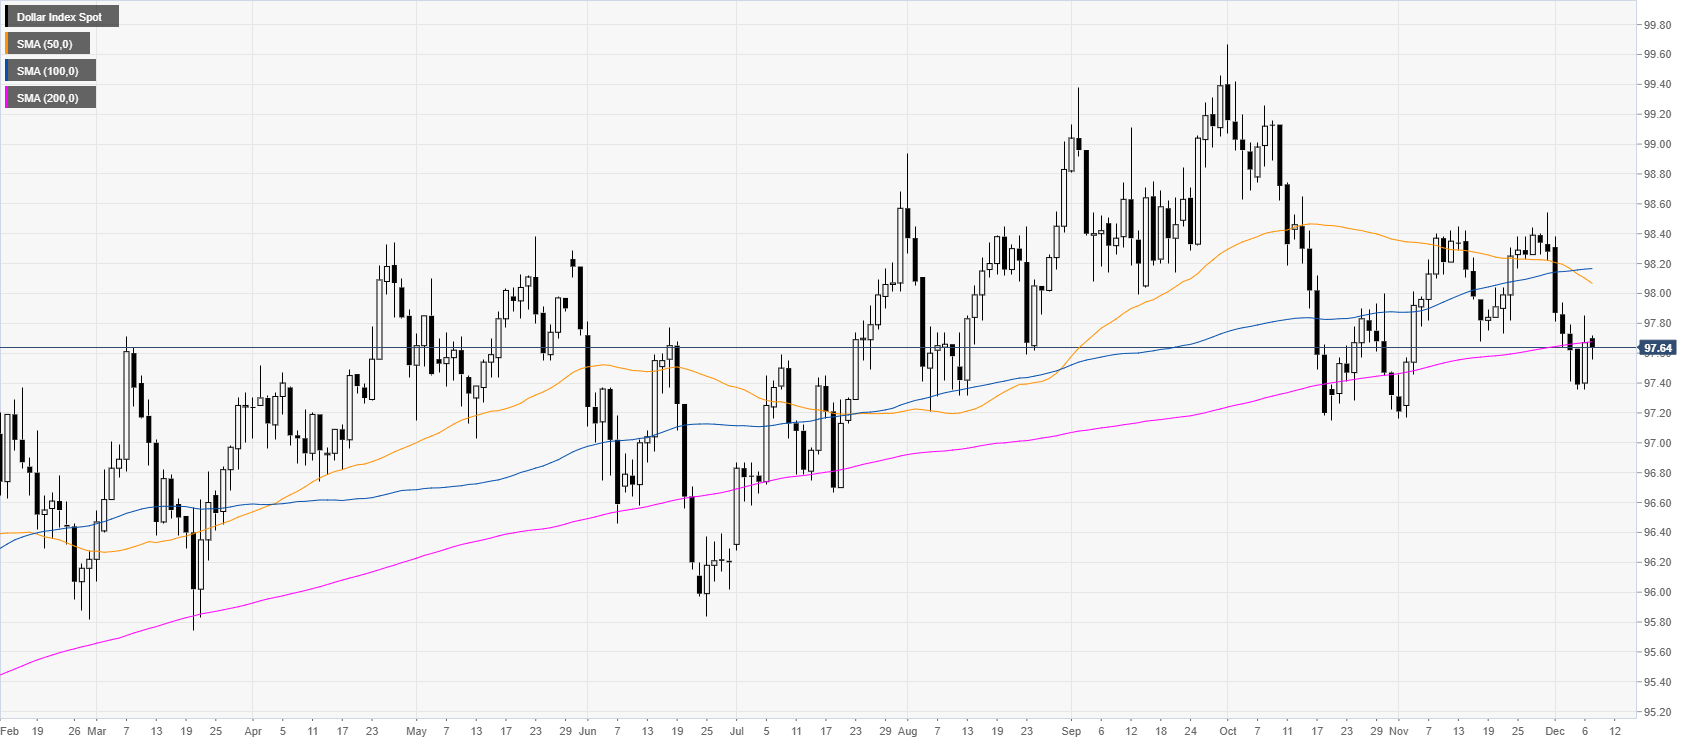
DXY daily chart
DXY (US Dollar Index) is evolving in a weak bull trend as the market is trading near the 200-day simple moving average (DMA).
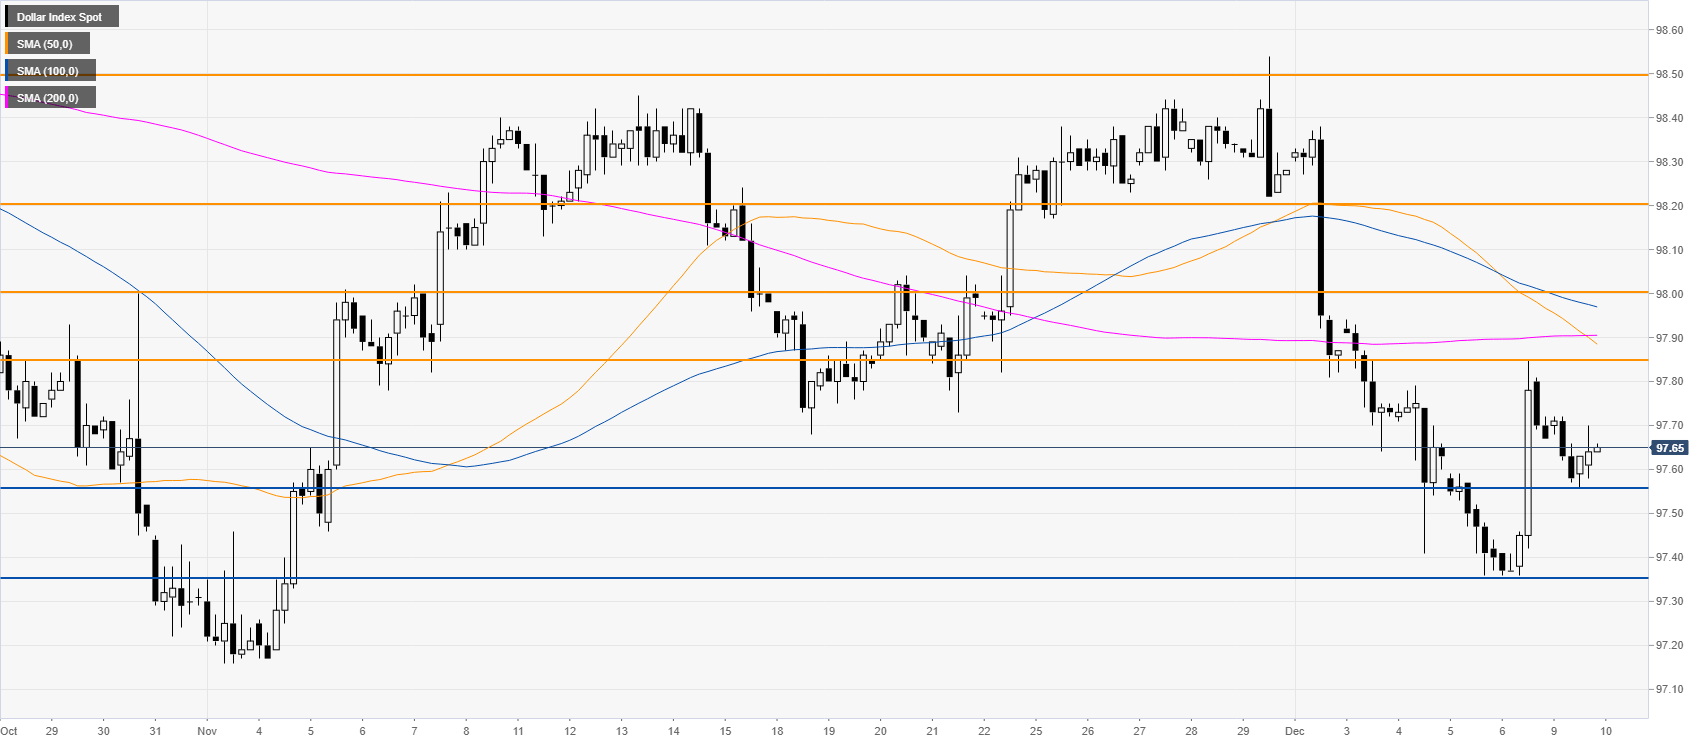
DXY four-hour chart
DXY remains in a range below the main SMAs. However, bulls are likely to take the lead on a break above the 97.85 resistance which can expose the 98.00/98.20 price zone. Further up lies the 98.50 level.
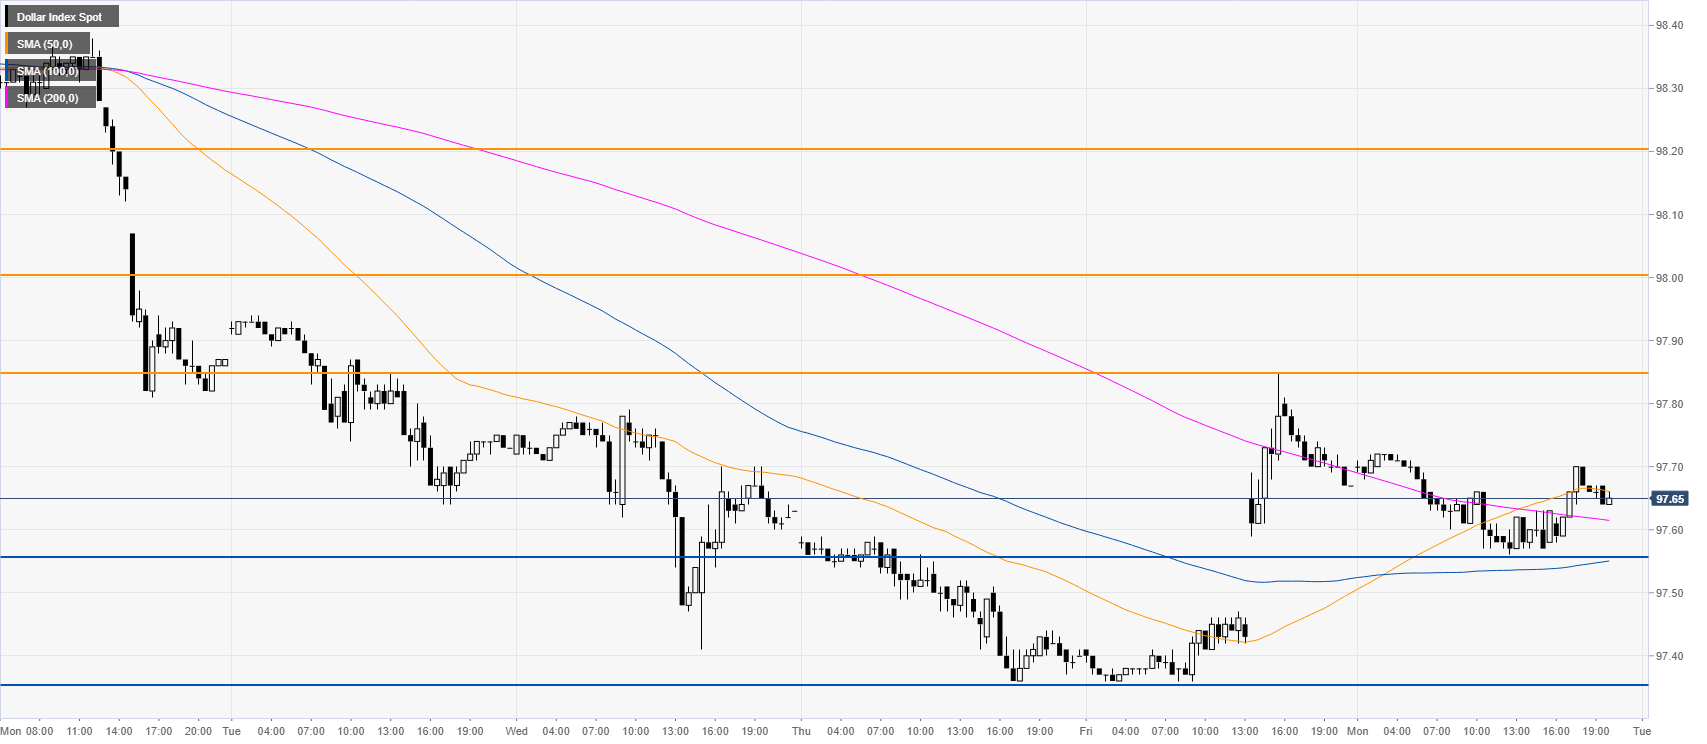
DXY 30-minute chart
DXY traded in a small consolidative range this Monday, although trading above the 100/200 SMAs into the New York close. Support is seen at 97.35 and 97.55 price levels.
Additional key levels
