- DXY extends recovery from a five-month-old rising support line.
- Multiple levels around 98.00/05 add to the resistance.
- 61.8% Fibonacci retracement, October low will be on Bears’ radar after trend line break.
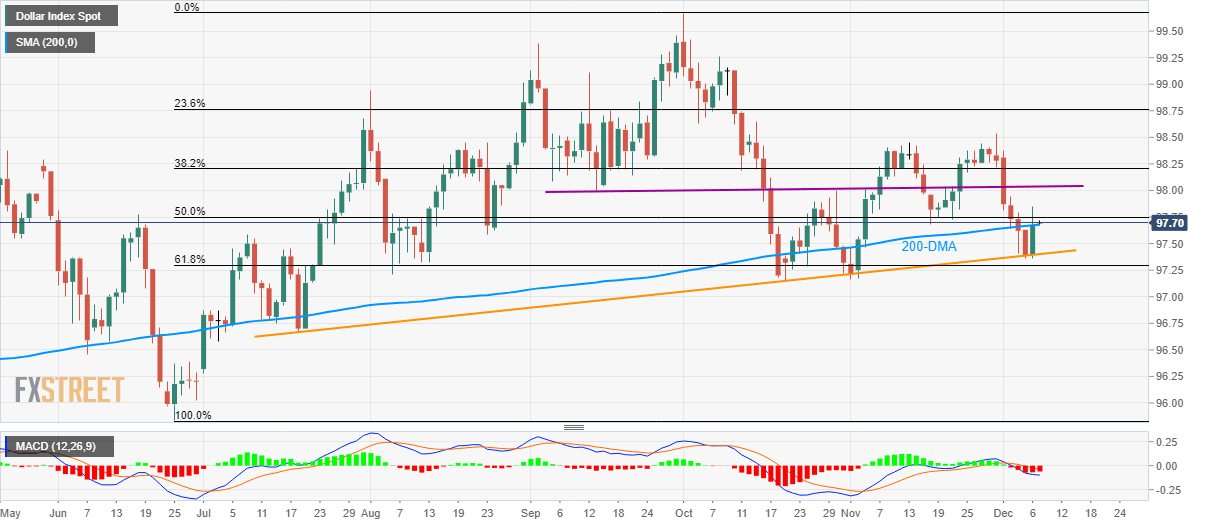
DXY (US Dollar Index) holds on to recovery gains, around 97.70, ahead of the European session on Monday. The quote recently bounces off an upward sloping trend line since July 18 and stays above 200-Day Simple Moving Average (DMA) by the press time.
Even so, 50% Fibonacci retracement of June-October rise, near 97.75, acts as an immediate upside barrier for the greenback gauge.
In a case where prices manage to rise past-97.75, multiple levels since mid-September, near 98.00/05, will become Bulls’ favorite.
Alternatively, the USD indicator’s decline below the 200-DMA level of 97.68 can drag it back to a multi-month-old rising support line of 97.40.
It should, however, be noted that a daily closing below 97.40 could avail stops near 61.8% Fibonacci retracement and October lows, 97.30 and 97.15 respectively. Though, further declines could make the quote vulnerable to drop to July lows close to 96.65.
DXY daily chart
Trend: Pullback expected
