- USD/CAD extends Friday’s recovery while confronting 21-DMA.
- 200-DMA, November high can please buyers beyond immediate resistance.
- 1.3160/55 could return during the declines below 61.8% Fibonacci retracement.
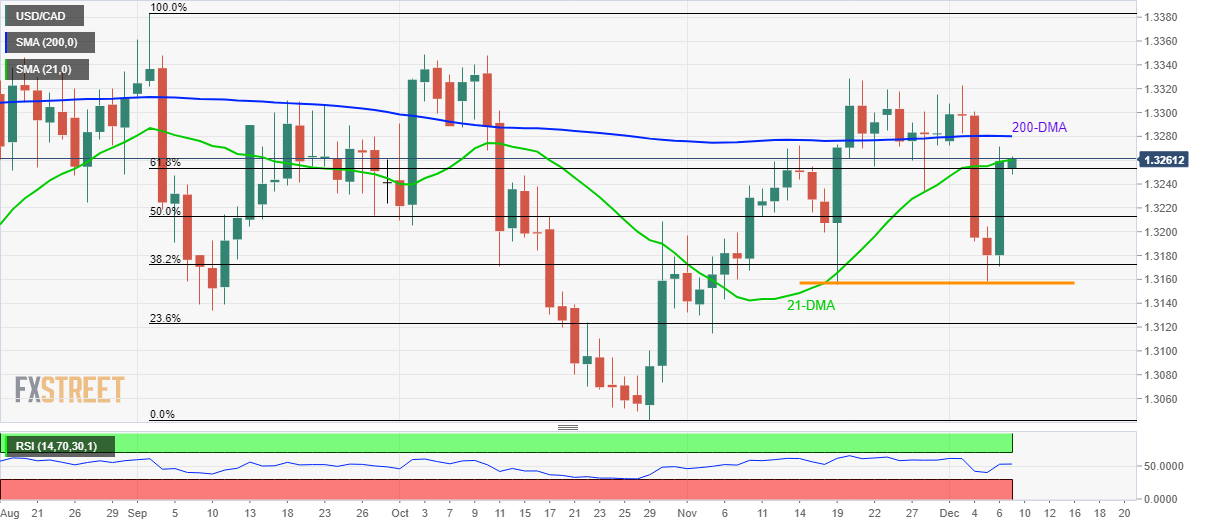
USD/CAD rises to an intra-day high of 1.3262 by the press time of early Monday. The pair holds on to recovery gains while confronting 21-Day Simple Moving Average (DMA).
Although sustained trading beyond the 21-DMA level of 1.3260 opens the gate for a 200-DMA level of 1.3280, the Bulls can’t be said to have full control as November month high near 1.3330 keeps them challenged.
Should there be a clear run-up above 1.3330, tops marked in October and September near 1.3350 and 1.3385 will return to the charts.
Alternatively, 61.8% Fibonacci retracement level of September-October fall around 1.3250 acts as immediate support, a break of which could drag prices to 50% Fibonacci retracement figure of 1.3213.
It’s worth mentioning that 1.3160/55 area including lows marked on November 19 and December 05 can restrict pair’s declines below 1.3213.
USD/CAD daily chart
Trend: Bullish
