- EUR/JPY is nearing the December highs as bulls have taken control.
- The level to beat for buyers is the 120.66 resistance.
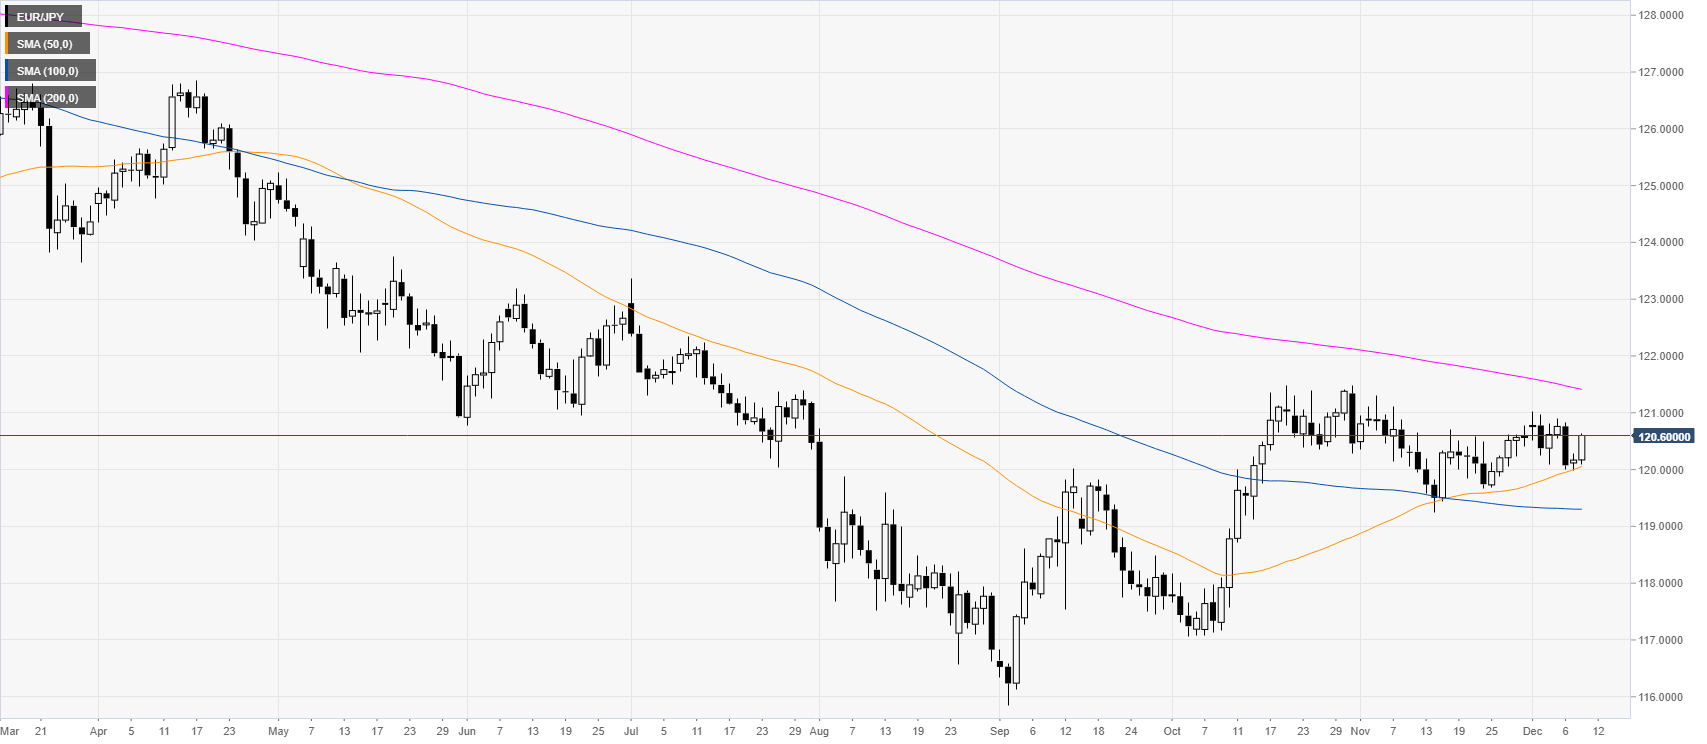
EUR/JPY daily chart
EUR/JPY is trading in a bear trend below its 200-day simple moving average (DMA). However, the exchange rate has been correcting the October’s rally below the 121.00 handle in the last weeks of trading.
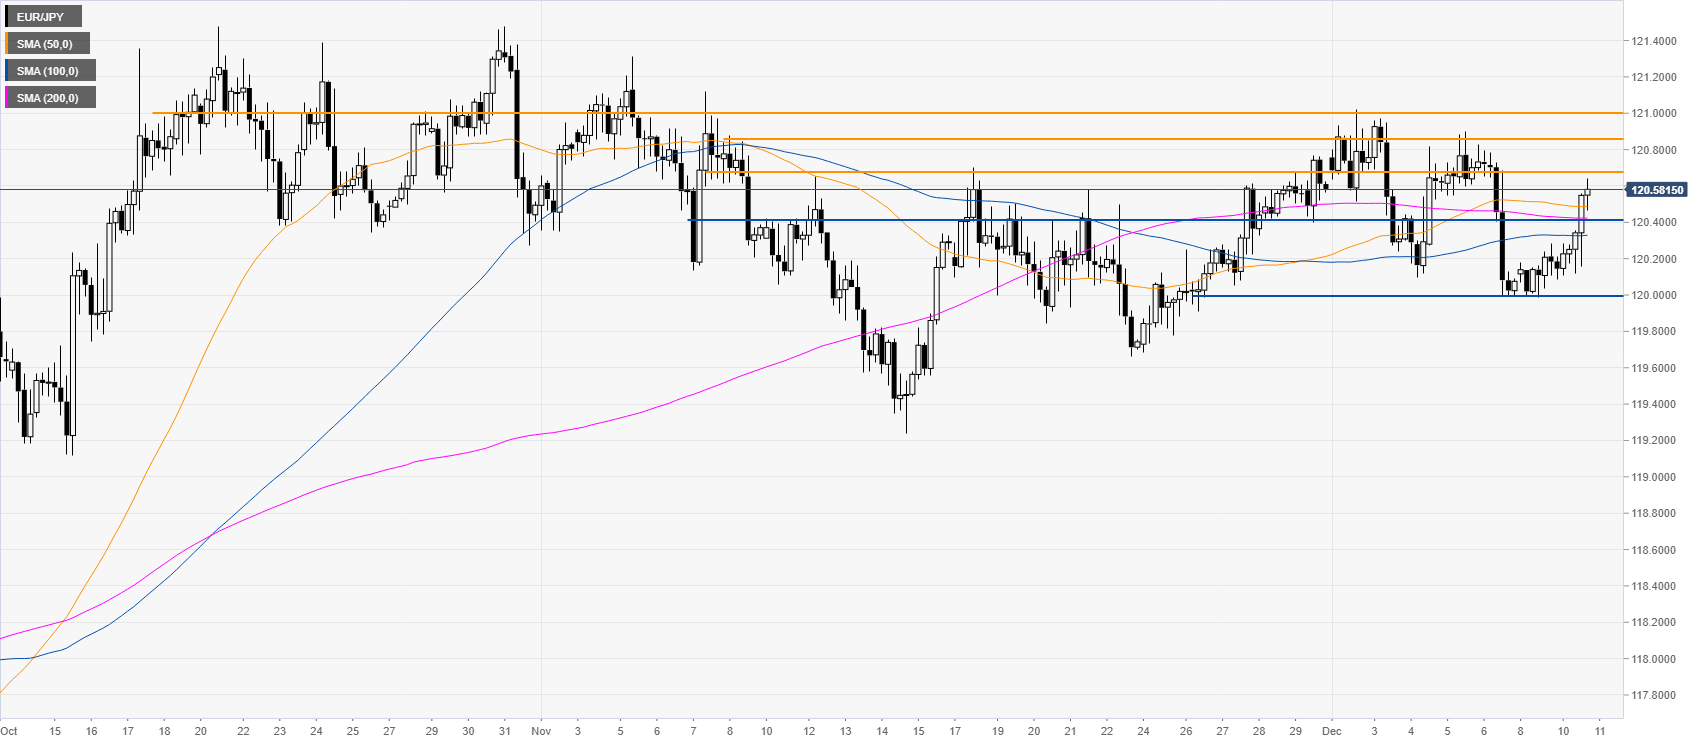
EUR/JPY four-hour chart
The spot broke to the upside on Tuesday. Buyers are looking for a break of the 120.66 resistance to travel towards 120.85 and the 121.00 handle near the December highs, according to the Technical Confluences Indicator.
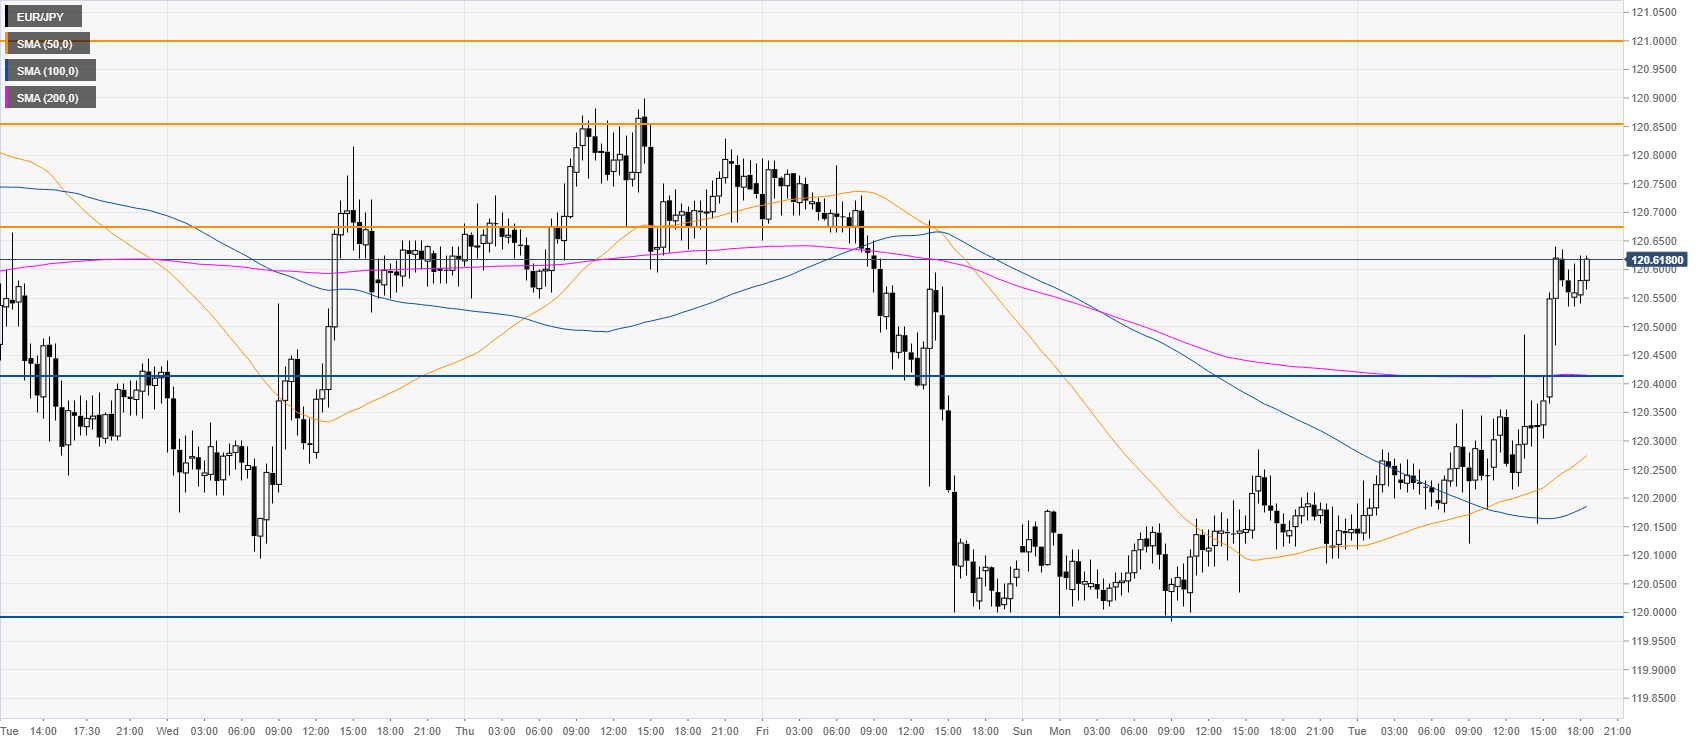
EUR/JPY 30-minute chart
The bulls have taken control above the main SMAs on the 30-minute chart. Support is seen at the 121.40 level. However, a daily close below this level could be seen as bearish and sellers might be starting to look at the 120.00 handle.
Additional key levels
