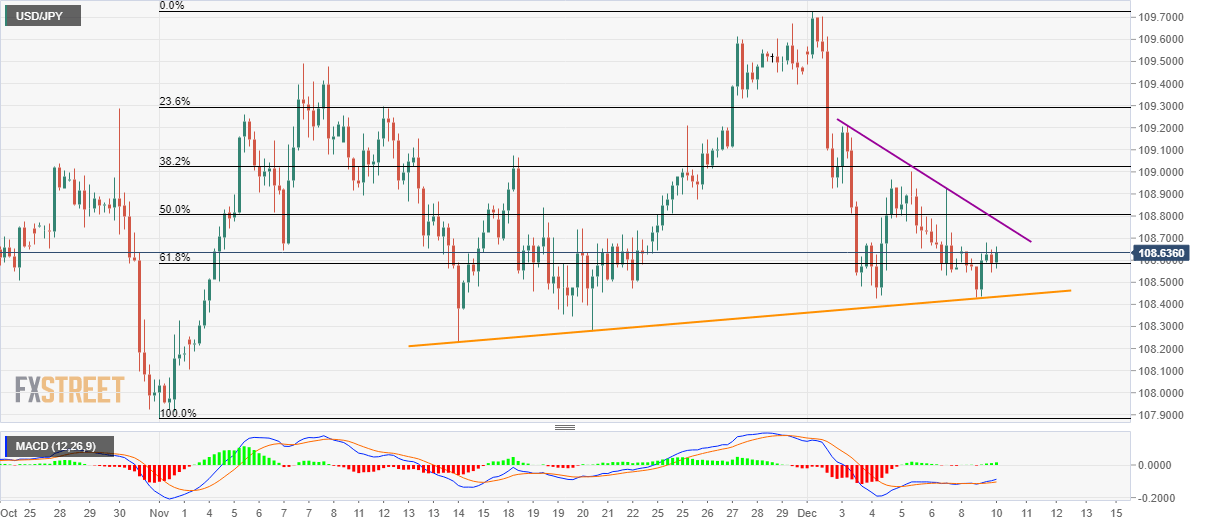
- USD/JPY seesaws around 61.8% Fibonacci retracement after bouncing off near-term key support.
- The immediate falling resistance line restricts the upside towards 23.6% Fibonacci retracement.
- A downside break below the support line can recall sub-108.00 territory.
USD/JPY declines to 108.61 during the initial trading session on Tuesday. In doing so, the pair seesaws around 61.8% Fibonacci retracement of early November-December upside while staying above near-term key support-line.
Although the pair’s failure to sustain the recent bounce indicates another drop to 108.40 figure comprising the said support line, its further downside becomes less expected amid the bullish signal from 12-bar Moving Average Convergence and Divergence (MACD).
If at all prices slip below 108.40, mid-November lows near 108.20 could offer intermediate halts to the previous month low near 107.90.
On the upside, pair’s rise past one-week-old falling trend line, at 108.80, can trigger fresh recovery to 109.20 while the monthly top close to 109.70 could be in focus then after.
Even if the quote manages to stay beyond 109.70, 110.00 becomes the tough nut to crack for buyers.
USD/JPY four-hour chart
Trend: Sideways
