- WTI struggles for direction after posting losses on Monday.
- Two-month-old rising trend-channel shows overall price strength.
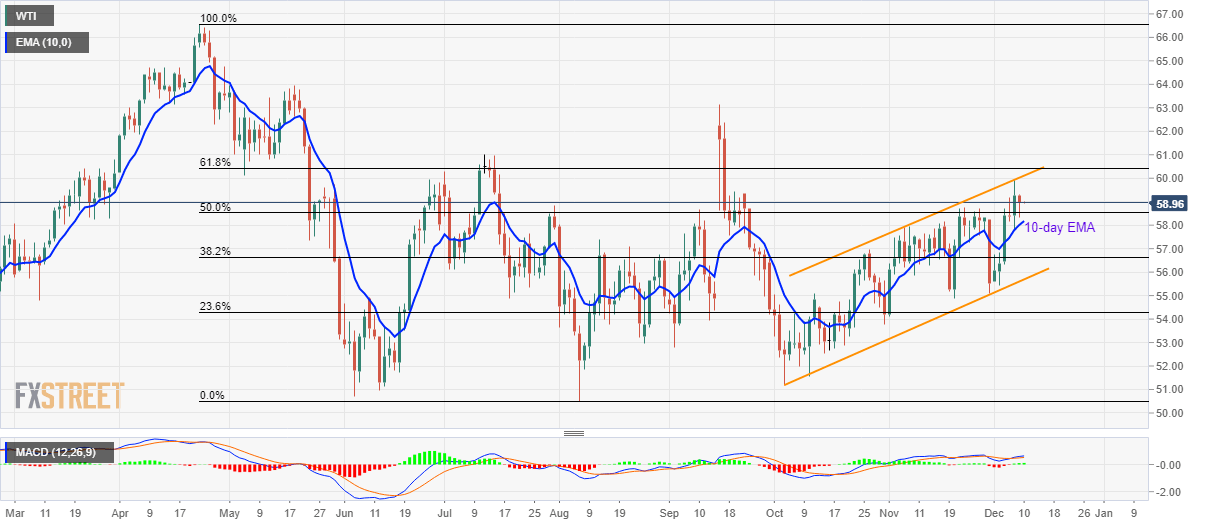
WTI refrains from extending the previous day’s declines while trading near $59.00 during the Asian session on Tuesday. The energy benchmark stays mostly upbeat inside the near-term ascending trend-channel formation.
50% Fibonacci retracement of April-August declines, at $58.54, followed by 10-day Exponential Moving Average (EMA) level around $58.15, limit the black gold’s immediate declines.
In a case where the quote slips beneath $58.15, 38.2% Fibonacci retracement level of $56.65 and the channel’s support near $55.70 becomes the key to watch.
Meanwhile, the upper line of the mentioned channel, close to $60.10, can act as immediate resistance holding the key to 61.8% Fibonacci retracement level of $60.45.
However, the price rally beyond $60.45 enables buyers to confront July month top near $61.00 ahead of targeting September month high adjacent to $63.15.
WTI daily chart
Trend: Bullish
