- EUR/JPY is trading mixed ahead of the FOMC at 19:00 GMT.
- Support is seen at the 120.66 level while resistance is at the 120.40 level.
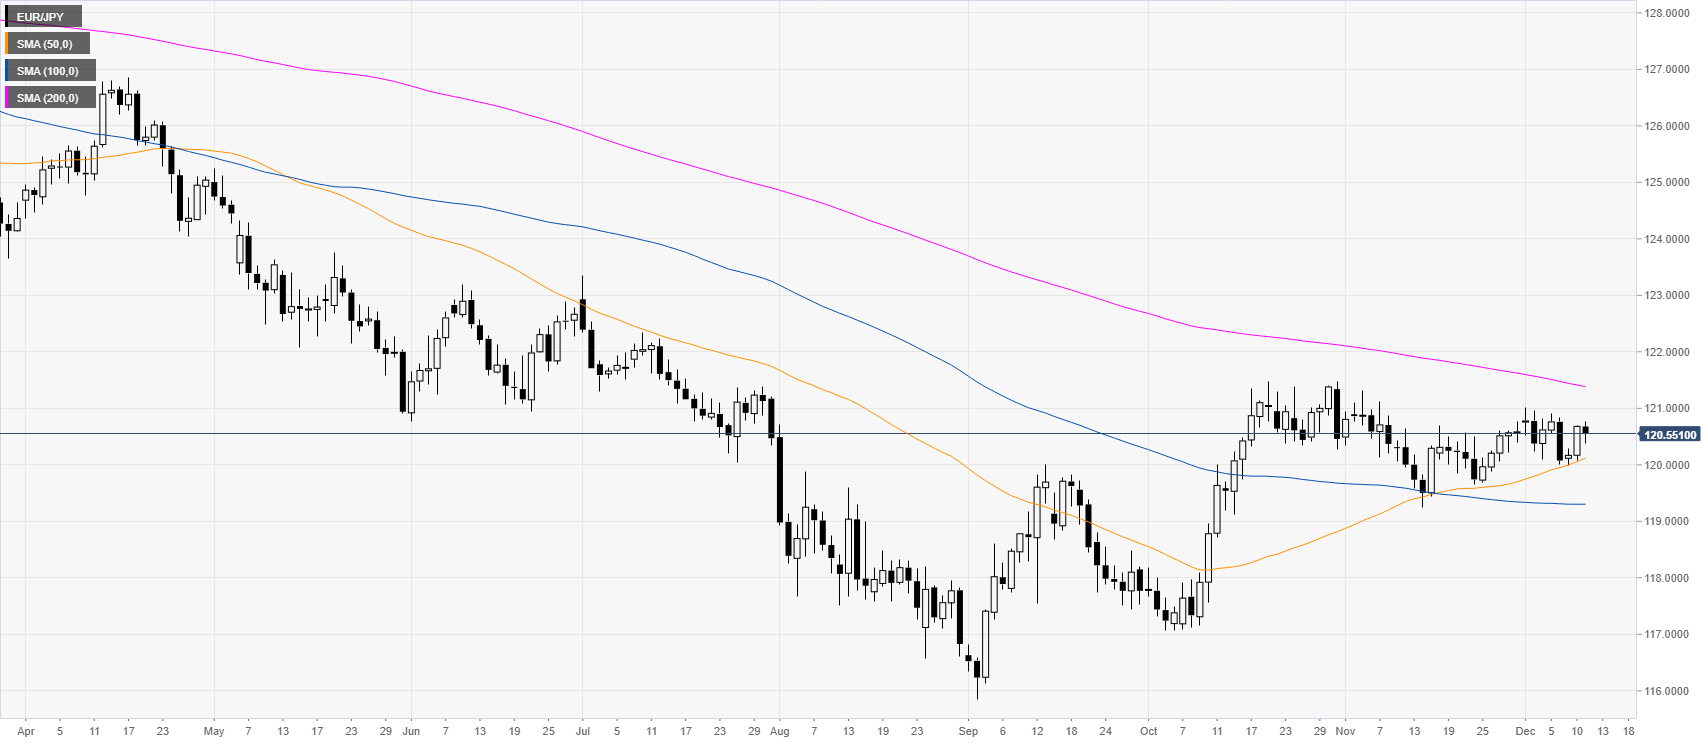
EUR/JPY daily chart
EUR/JPY is trading in a downtrend below the 200-day simple moving average (DMA). However, the market has been consolidating the October’s rally below the 121.00 handle in the last weeks of trading. Although the Fed’s rate decision affect mostly USD-related pairs, to a lesser extent, it could also indirectly affect EUR/JPY.
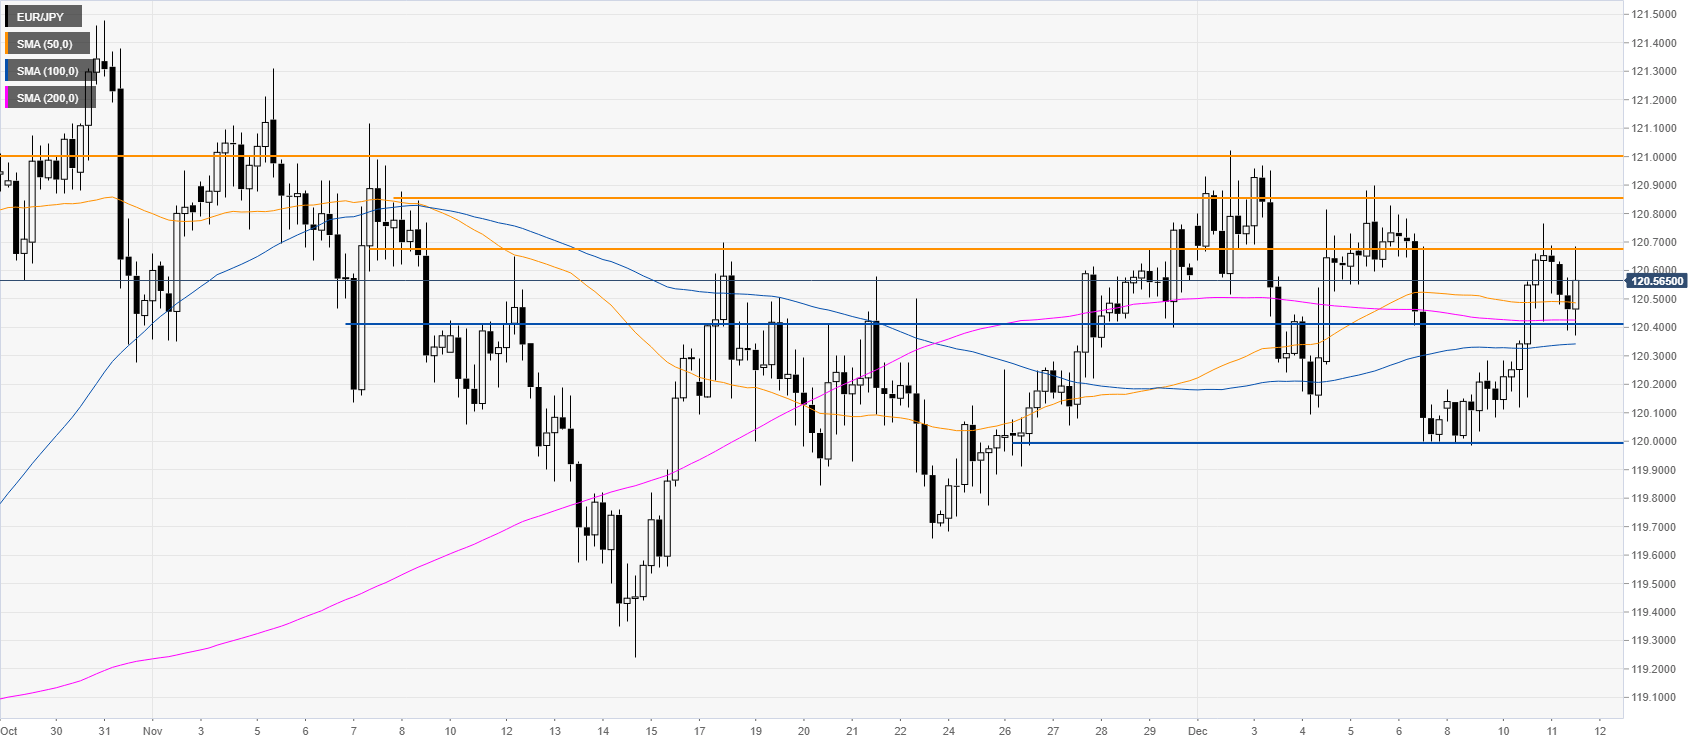
EUR/JPY four-hour chart
The break above the 120.66 resistance failed and the cross is consolidating the recent gains above the 120.40 support level. Bulls would need a daily break of the 120.66 resistance to travel towards 120.85 and the 121.00 handle near the December highs, according to the Technical Confluences Indicator.
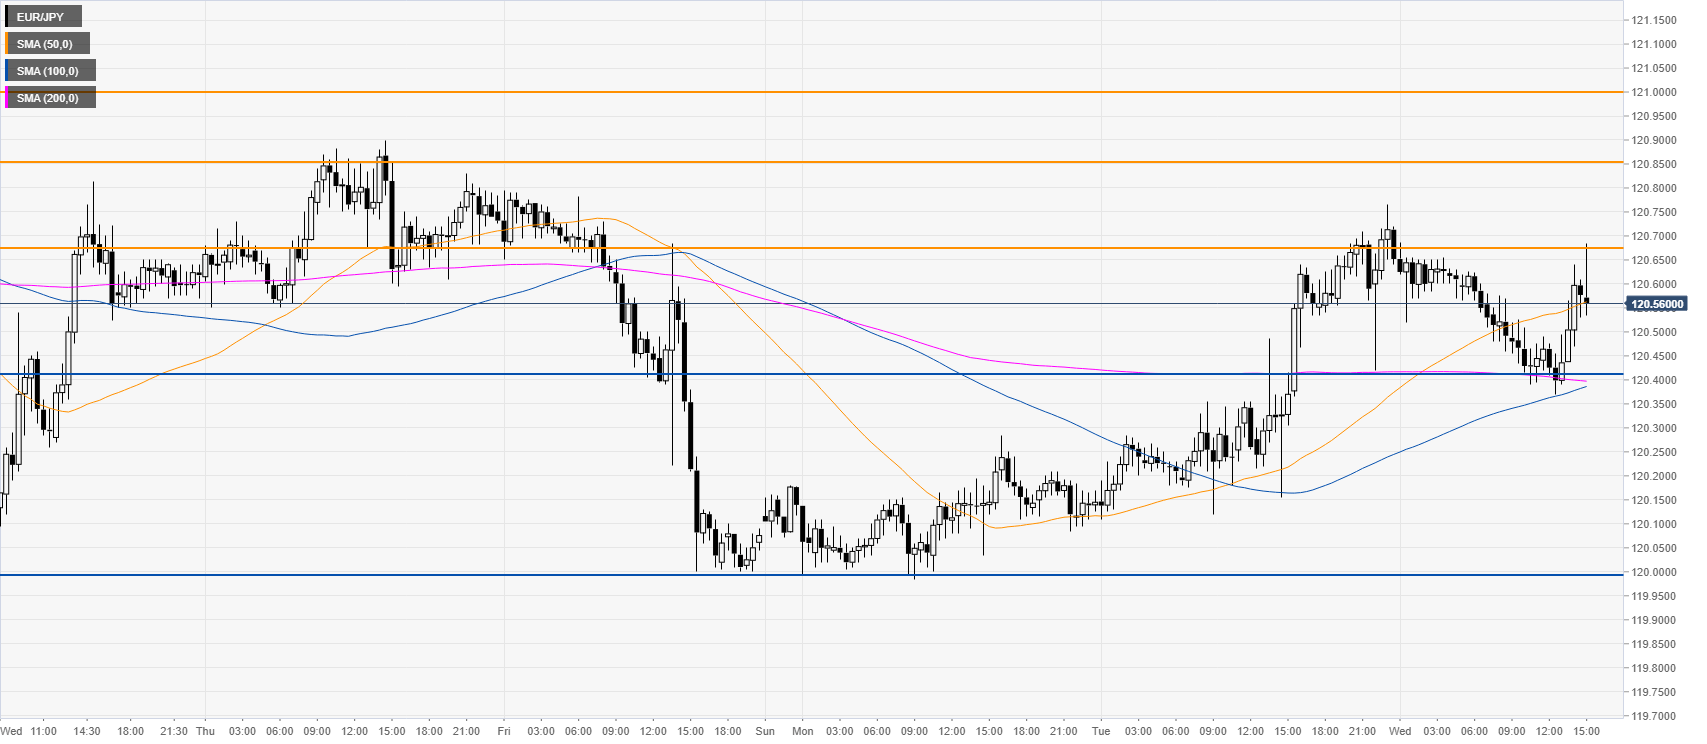
EUR/JPY 30-minute chart
The bulls have taken control above the 100/200 main SMAs on the 30-minute chart. Support is seen at the 120.40 level. However, a daily break below this level would likely attract selling interest for a potential dive to the 120.00 handle.
Additional key levels
