- USD/JPY pulls back from 200-hour EMA, stays within the nearby bullish formation.
- 61.8% Fibonacci retracement can please buyers, November low may gain sellers’ attention after the channel’s break.
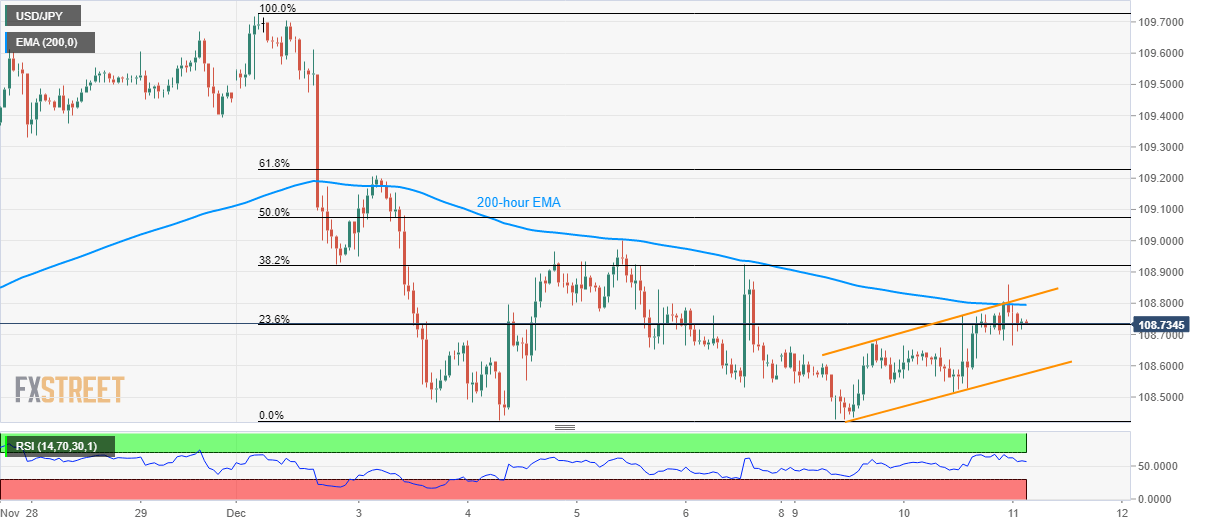
USD/JPY recently took a U-turn from 200-hour Exponential Moving Average (EMA). Even so, it stays well within the two-day-old rising trend-channel formation. The pair trades around 108.75 by the press time of early Wednesday.
With this, sellers will look for entry below the said channel’s support line, at 108.55. In doing so, 108.00 and November month low near 107.90 will be in focus.
On the flip side, a sustained break of 200-bar EMA level of 108.80 needs validation from the channel’s resistance, at 108.85, to rise towards December 05 high of 109.00.
Further, 61.8% Fibonacci retracement of the current month declines, at 109.23, holds the key to pair’s additional upside beyond 109.00.
Though, May-end top near 109.93 and 110.00 could keep the pair Bulls in check beyond 109.00.
USD/JPY hourly chart
Trend: Pullback expected
