- EUR/USD keeps creeping up but can the bulls overcome the 1.1218 resistance?
- The level to beat for sellers is the 1.1125 resistance.
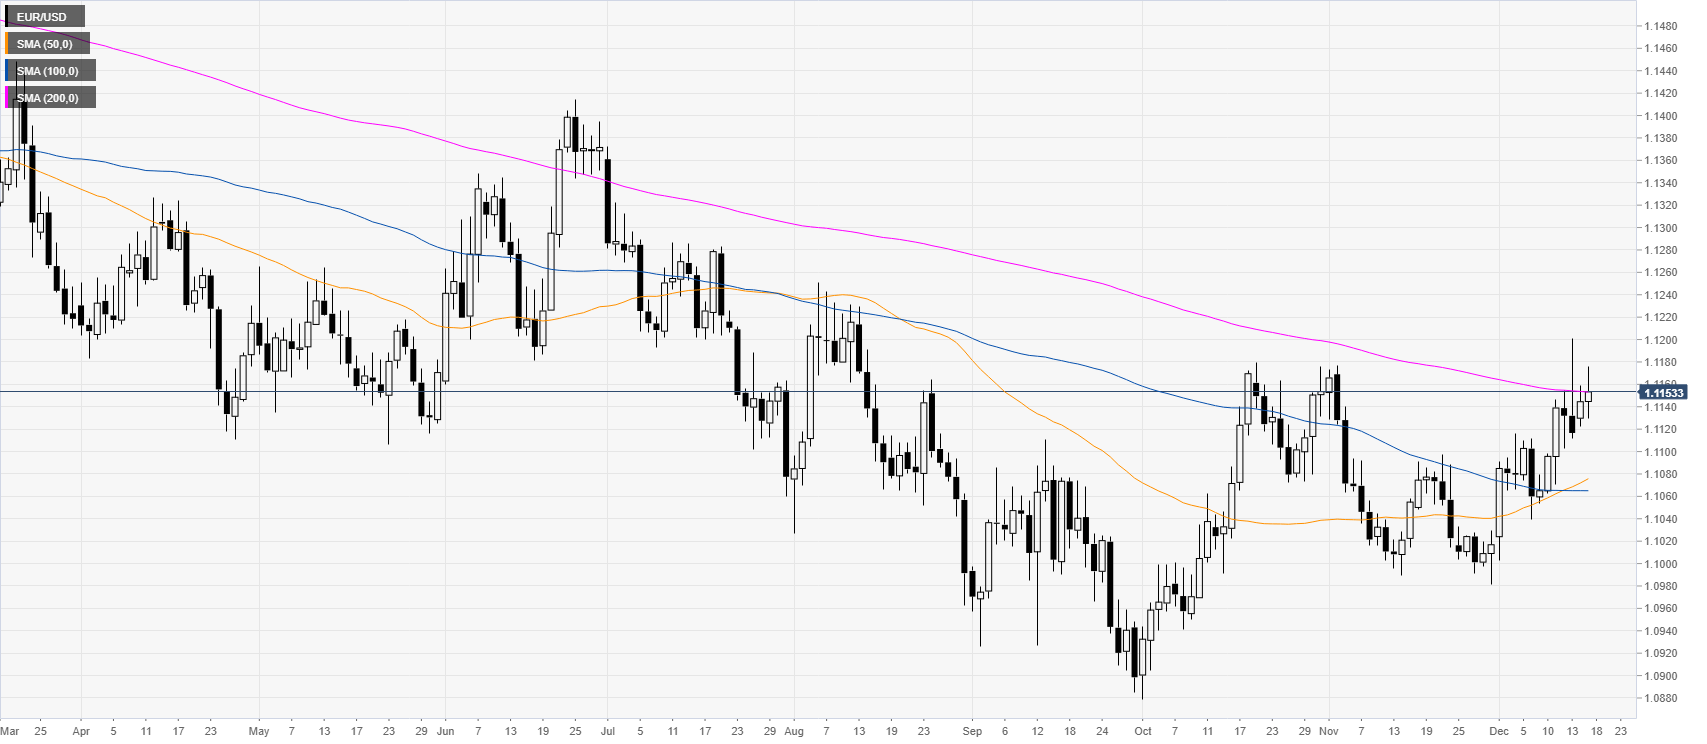
EUR/USD daily chart
The euro keeps challenging the 200-day simple moving average (DMA) as the buyers want a daily close above the 200 DMA. However, this hasn’t happened since June 2019.
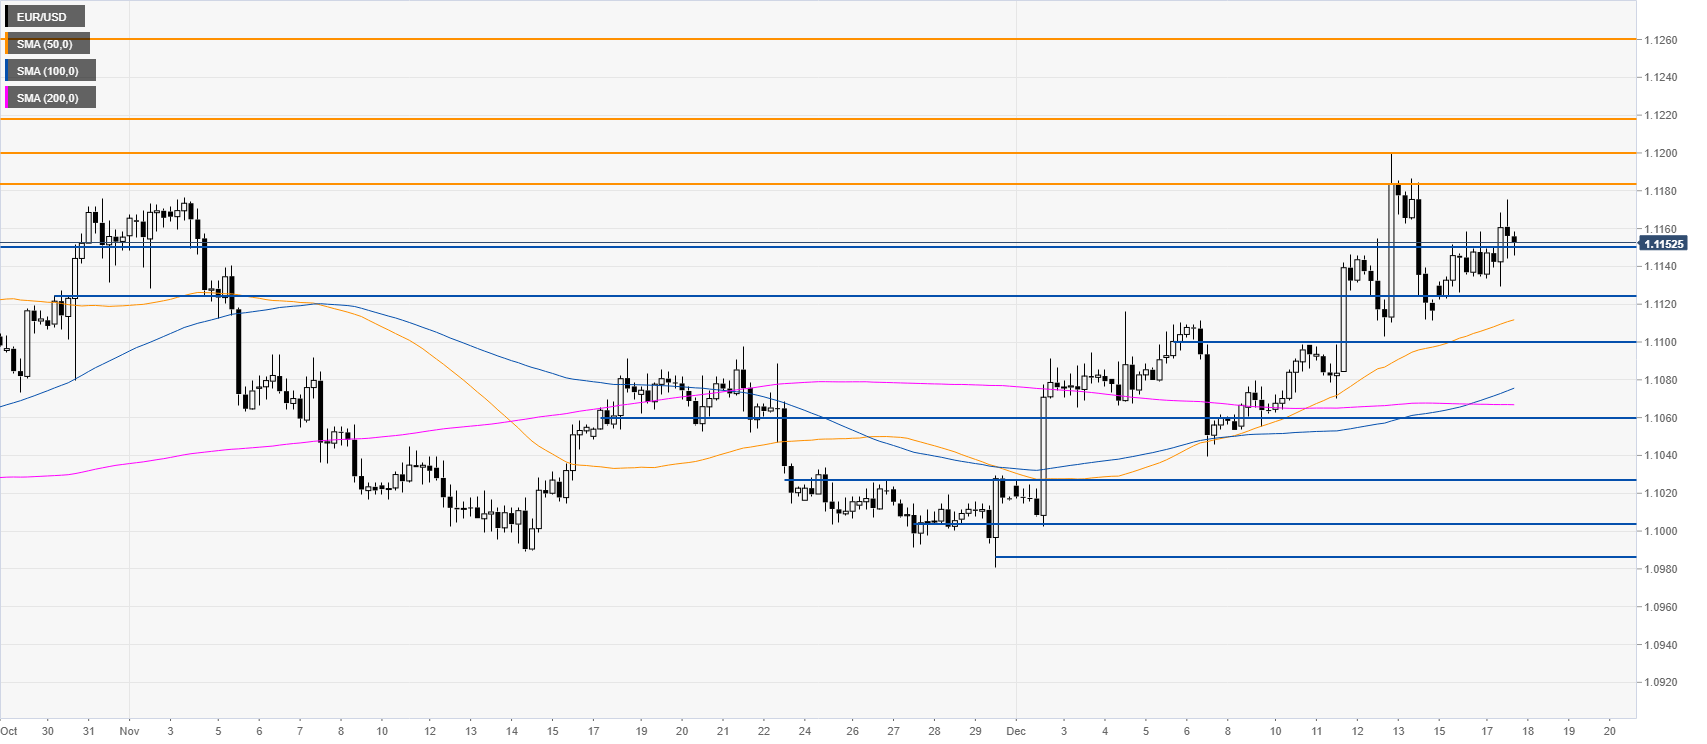
EUR/USD four-hour chart
The spot printed a head-and-shoulders pattern that can potentially become bearish. Moreover, the lack of bullish enthusiasm below the 1.1183/1.1200 resistance zone suggests that bulls might be running out steam. Sellers would be looking for a break below 1.1125, which could be followed by a drop to the 1.1102 and 1.1060 levels.
On the flip side, a daily close above the 1.1218 resistance would be very bullish as it could entail a potential bullish continuation towards the 1.1260 level, according to the Technical Confluences Indicator.
Additional key levels
