- DXY is showing signs of bullish interest, but bulls need to overcome the 97.25/55 resistances.
- The level to beat for bulls is the 97.25 resistance.
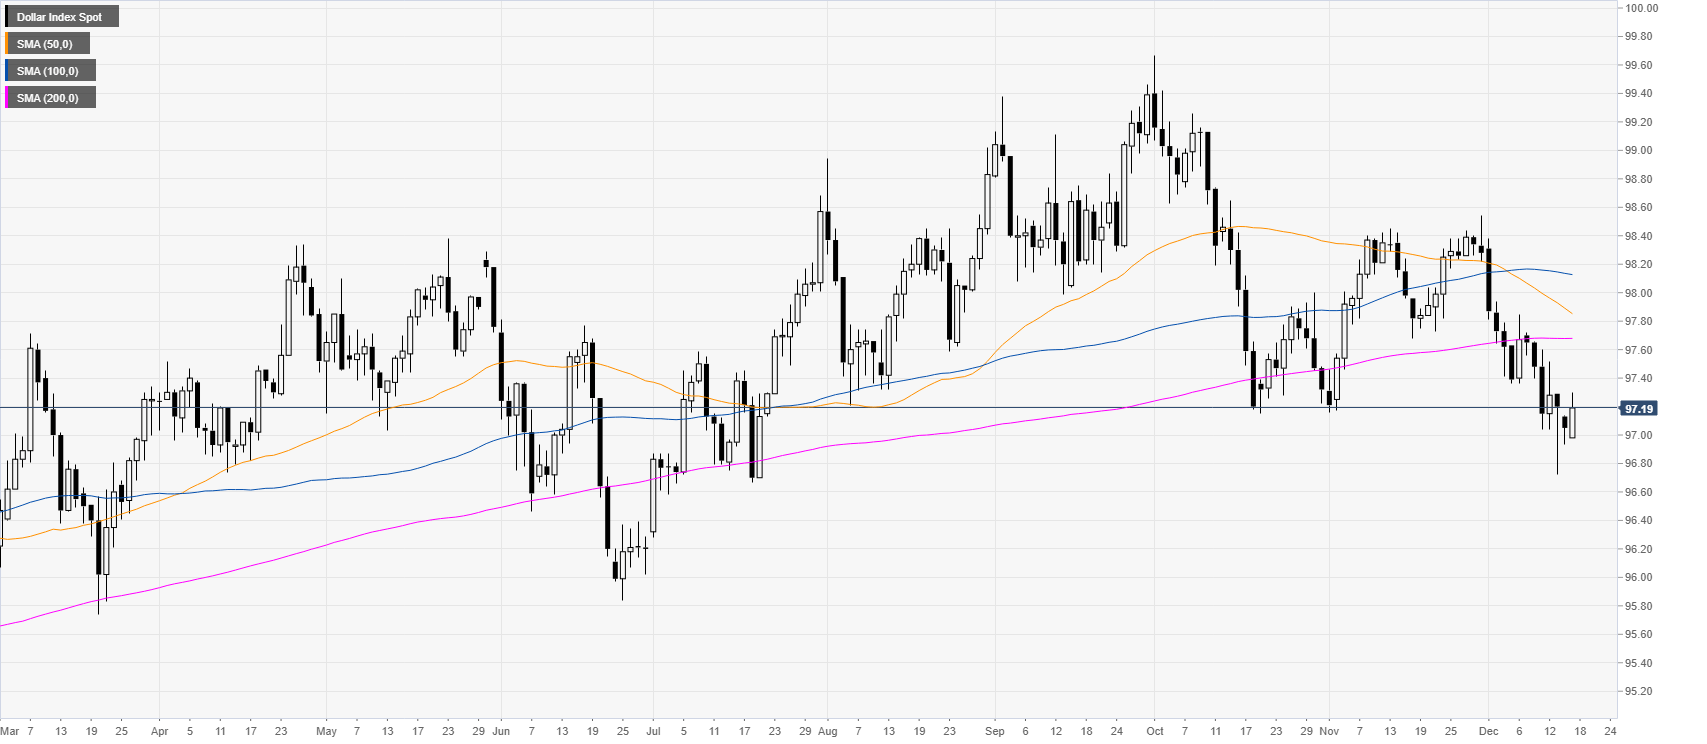
DXY daily chart
DXY (US Dollar Index) is hovering below the 200-day simple moving average (DMA) while holding above the 97.00 handle for the third consecutive day.
DXY four-hour chart
DXY bulls are pressuring the 97.25 resistance as they want to resume the main bull trend. If the market break above the 97.25 level and the 50 SMA, the next resistance is seen at 97.55 and 97.85 level near the 200 SMA. Conversely, a daily close below 96.70 could be seen as a bearish confirmation for further declines towards 96.50 and 96.25.
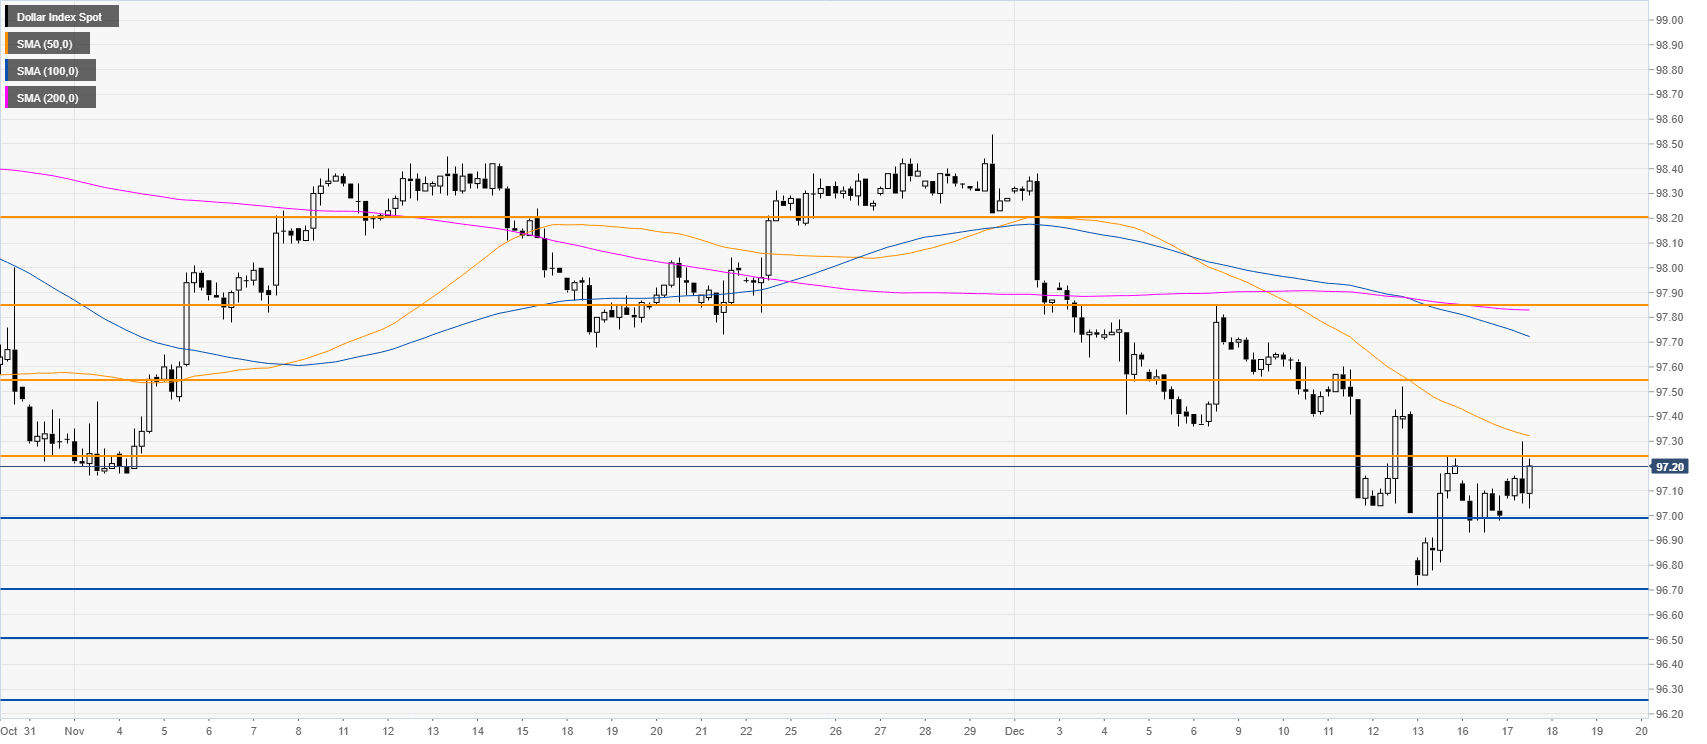
Additional key level
