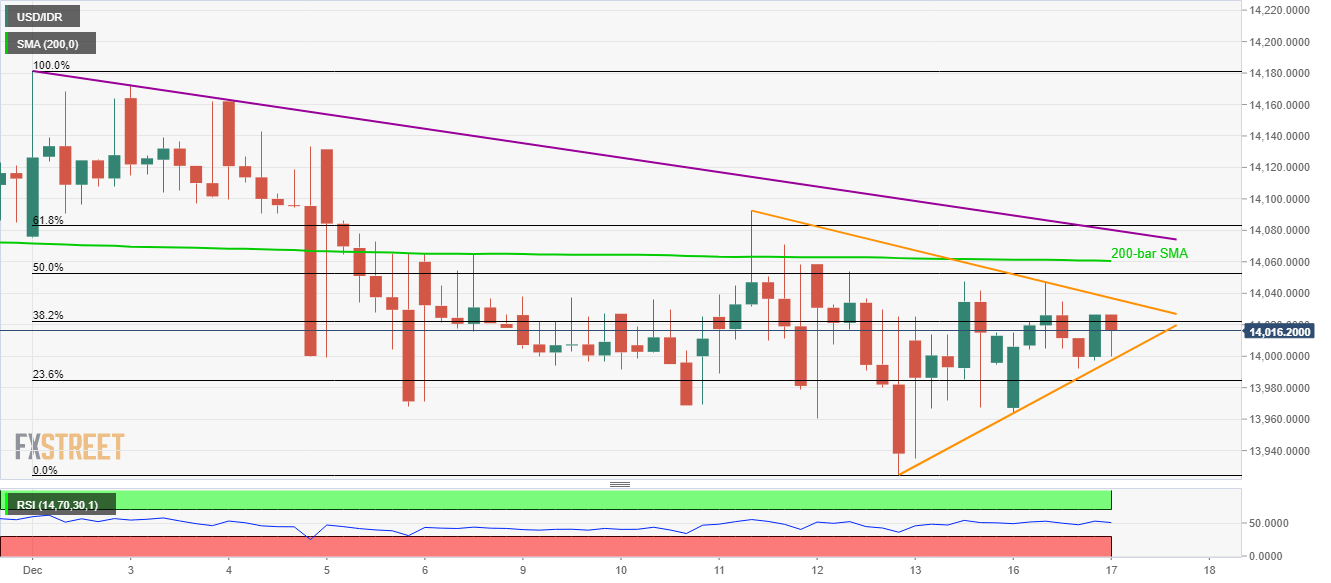
- USD/IDR funnels down to the end of the short-term symmetrical triangle.
- 200-bar SMA, the monthly trend line add to the resistance.
- The current month low holds the key to July, September months’ bottoms.
USD/IDR stays inside four-day-old triangle formation while trading around 14,015 during early Tuesday. In doing so, the pair remains below 200-bar Simple Moving Average (SMA) and a downward sloping trend line since December 02.
A sustained downside break of aforementioned triangle support, at 13,997 now, can drag prices to 13,965 and the monthly bottom surrounding 13,925.
However, lows marked in July and September months, close to 13,880, will keep further declines guarded.
On the upside, pair’s break of formation resistance, at 14,036 now, can push the quote towards a 200-bar SMA level of 14,060 and then to short-term falling resistance-line around 14,080.
In a case the Bulls manage to dominate beyond 14,080, monthly top nearing 14,180 and 14,300 will be on their radars.
USD/IDR four-hour chart
Trend: Sideways
