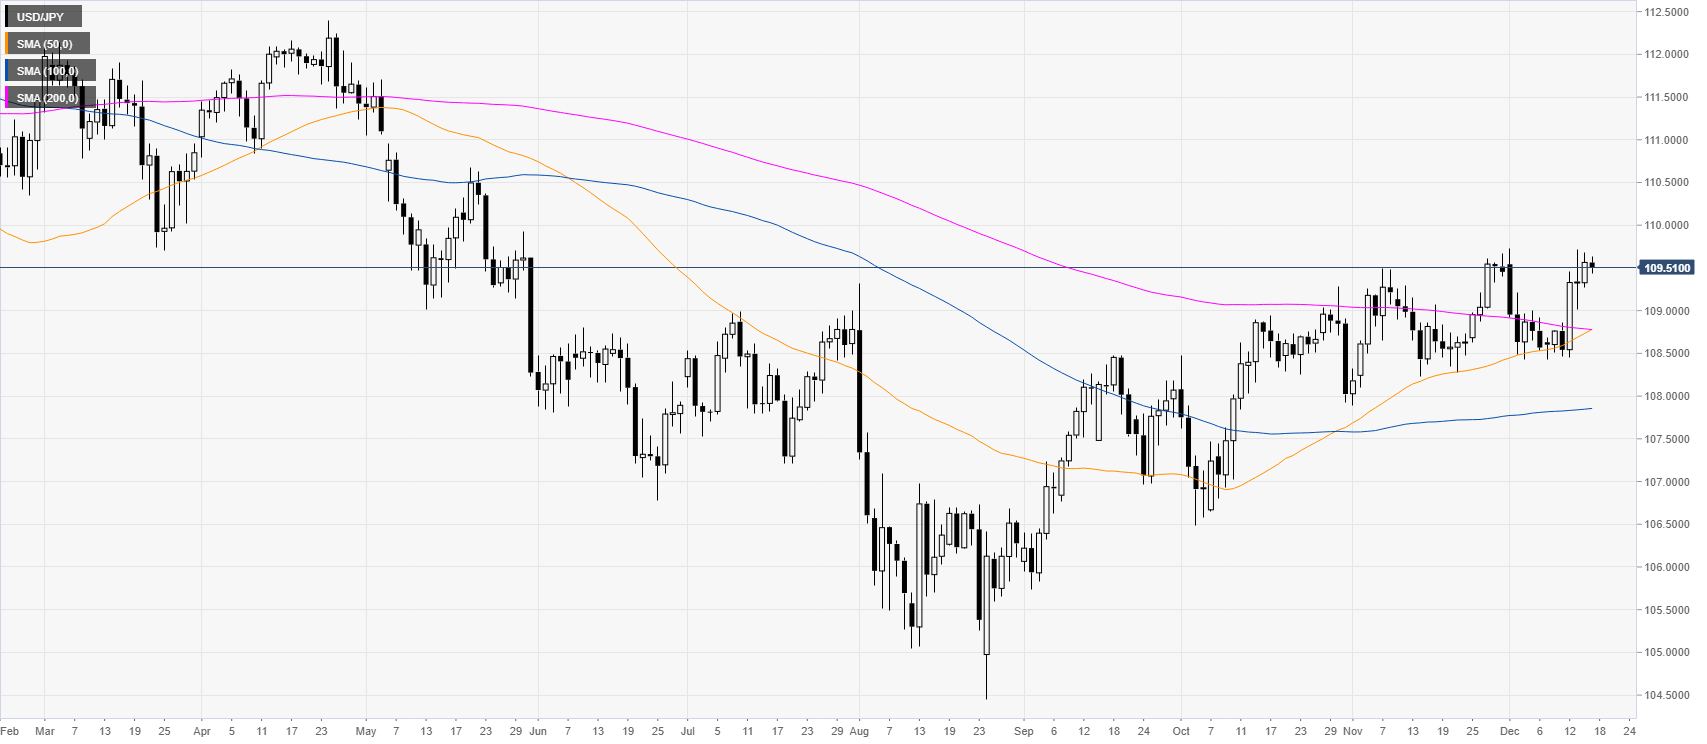
- USD/JPY is stuck at a cross-road trading above the 109.50 level, which was a significant level in 2019.
- The level to beat for buyers is the 109.75 resistance.
USD/JPY daily chart
USD/JPY is trading near the November/December highs just above the 109.50 level, which acted as a strong support and resistance level throughout the year 2019.
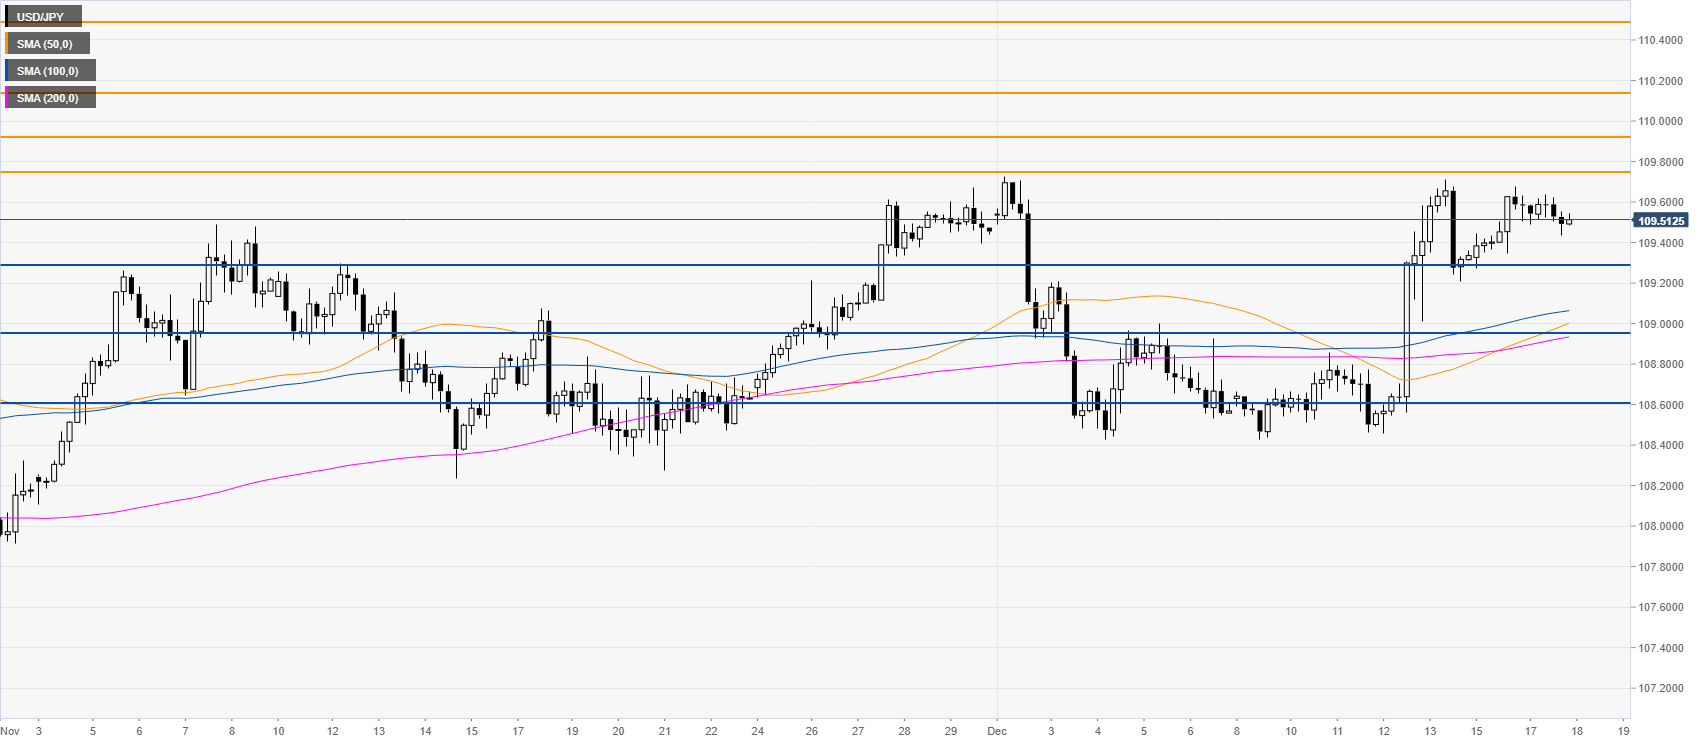
USD/JPY four-hour chart
The spot is trading in a small range below the 109.75 resistance. The bulls are looking for a clear breakout above the level to extend the current bullish move towards the 109.92, 110.14 and 110.49 levels. However, the 109.75 level could be a strong resistance and the bulls will likely need a convincing catalyst to gather conviction. On the flip side, if the sellers drive the price down below the 109.30 level, the market could tumble towards the 108.95 and 108.61 price levels, according to the Technical Confluences Indicator.
Additional key levels
