- AUD/JPY stays under pressure around 23.6% Fibonacci retracement of October-December upside.
- Early-month top, the five-week-old rising trend line on the sellers’ radar.
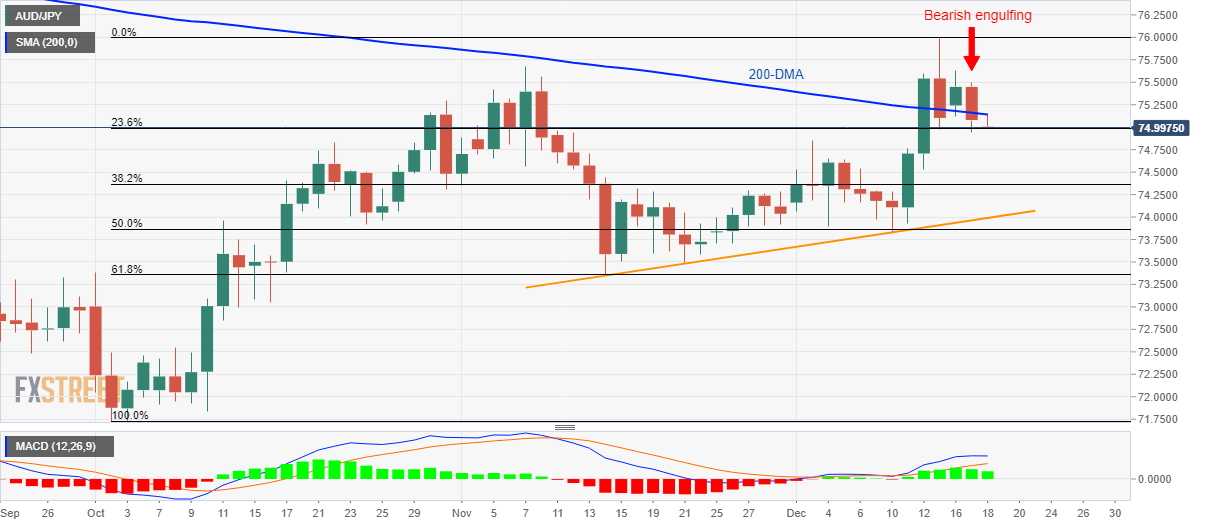
After flashing a bearish candlestick formation on the daily (D1) chart, AUD/JPY trades around 75.00 amid Wednesday morning in Asia. The pair now clings to 23.6% Fibonacci retracement of its run-up from October start.
During further declines, based on the bearish engulfing, the early-month top near 74.85 and 38.2% Fibonacci retracement close to 74.35 can entertain immediate sellers.
However, pair’s downside below 74.35 will be confined by a short-term rising trend line, surrounding 74.00, if not then 61.8% Fibonacci retracement and November month low, close to 73.36/35, will lure the Bears.
Meanwhile, 200-Day Simple Moving Average (DMA) level of 75.15 offers immediate resistance to the pair, a break of which could recall 75.60 back to the chart.
Though, the monthly top near 76.00 and the yearly high around 76.30 could restrict the pair’s rise past-75.60.
AUD/JPY daily chart
Trend: Pullback expected
