- AUD/JPY declines gradually while following a four-day-old descending trend line.
- The early-month top seems to limit the immediate downside.
- Bearish MACD favors the sellers.
AUD/JPY extends the weakness while trading around 75.10 during early Thursday morning in Asia. The pair forms a short-term descending triangle, a bullish technical pattern, but has been shy of the breakout off-late.
Considering repeated failures to confirm the bullish chart formation, coupled with bearish signals from 12-bar Moving Average Convergence and Divergence (MACD), prices are likely to revisit the early-month tops, around 74.80.
In a case where the quote slips beneath the pattern’s support-line, that’s near 74.80, 61.8% Fibonacci retracement of November-December upside and December 10 low, close to 74.35 and 73.80 respectively, will be on the sellers’ radar.
Meanwhile, pair’s rise beyond the pattern’s resistance, at 75.20 now, can propel it to the weekly top near 75.65 ahead of challenging the monthly highs adjacent to 76.00.
AUD/JPY four-hour chart
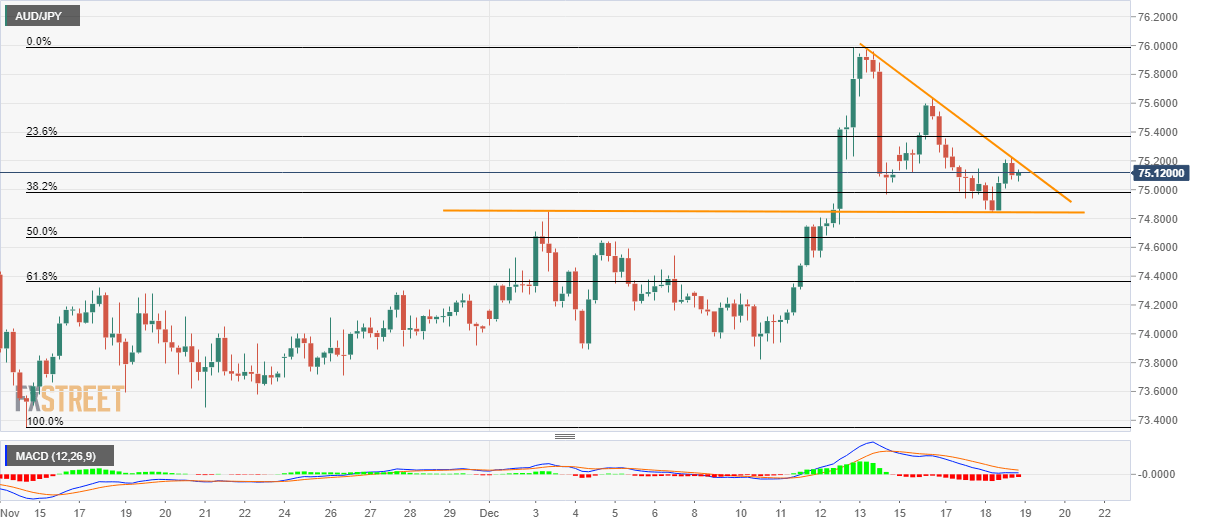
Trend: Bearish
