- DXY is slowly recovering from the December lows but still below the 200 DMA.
- The level to beat for bulls is the 97.55 resistance.
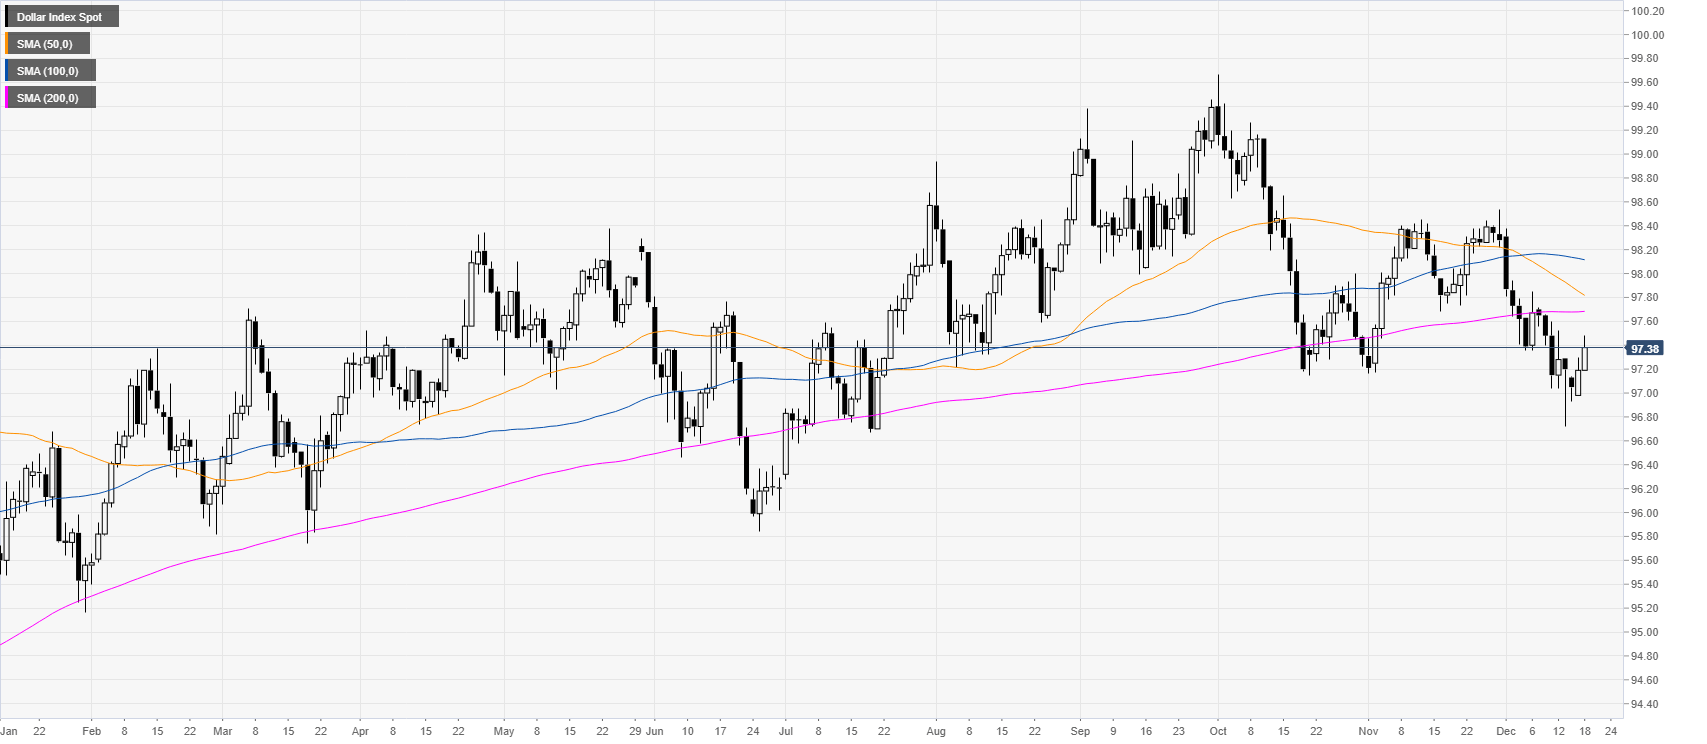
DXY daily chart
DXY (US Dollar Index) is trading off the December lows but still below the 200-day simple moving average (DMA).
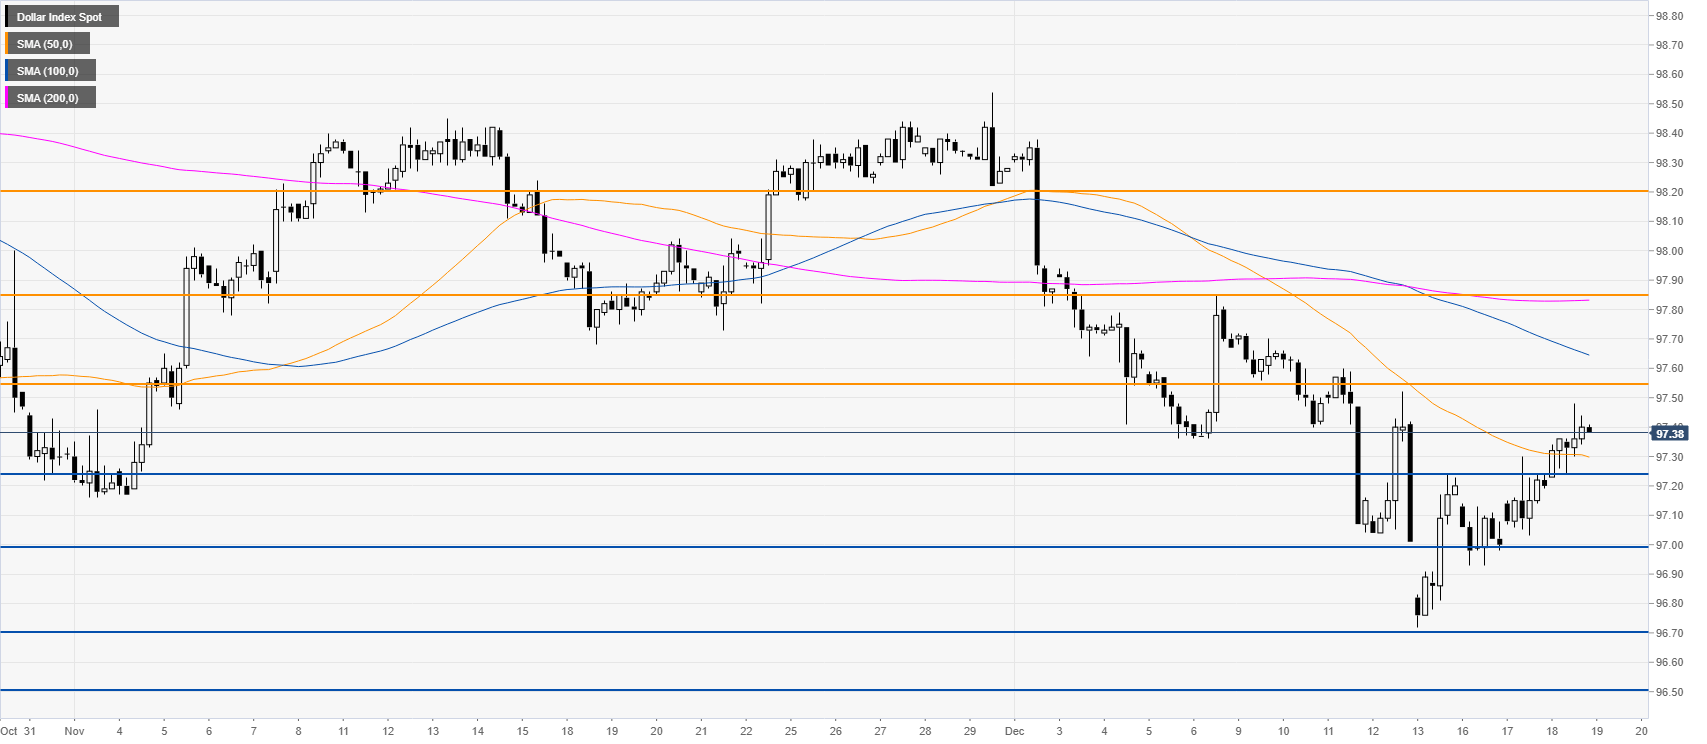
DXY four-hour chart
The buyers broke above the 97.25 resistance and the 50 SMA while slowly advancing towards the 97.55 resistance. A break above this level is necessary for a continuation of the recovery towards the 97.85 level. Support is seen at 97.25 and the 97.00 handle.
Additional key level
