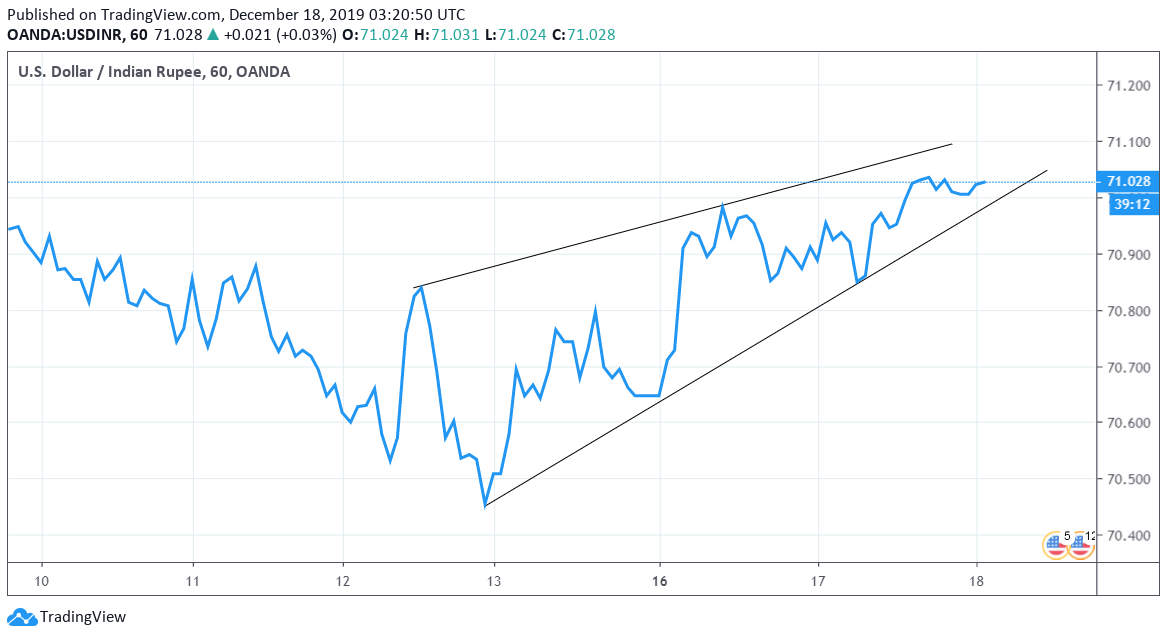
- USD/INR’s hourly line chart is reporting a rising wedge pattern.
- A wedge breakdown will likely fuel a drop to 70.82.
USD/INR’s bounce from the Dec. 13 low of 70.44 to Tuesday’s high of 71.16 has taken the shape of a rising wedge pattern on the hourly line chart.
A rising wedge comprises converging trendlines connecting higher lows and higher highs. The converging nature of the trendliens indicates bullish exhaustion. As a result, rising wedge breakdown is considered a bearish reversal sign.
At press time, the lower edge of the rising wedge is seen at 70.98. Acceptance below that would weaken the bullish case put forward by Friday’s inverted hammer and open the doors for test of support at 70.82.
On the higher side, resistance is seen at 71.16. A violation there would expose 71.45 (61.8% Fib R of 72.07/70.44).
Hourly chart
Trend: Neutral
Technical levels
