- USD/JPY registers another U-turn from 109.75/70 resistance-zone.
- 10-day EMA grabs short-term sellers’ attention.
- 110.00 adds to the upside barriers ahead of May month top.
USD/JPY remains downbeat for the back to back the second day while declining to 109.44 amid the pre-European session on Wednesday. That said, the pair formed a bearish candlestick pattern on the daily (D1) chart during the previous day.
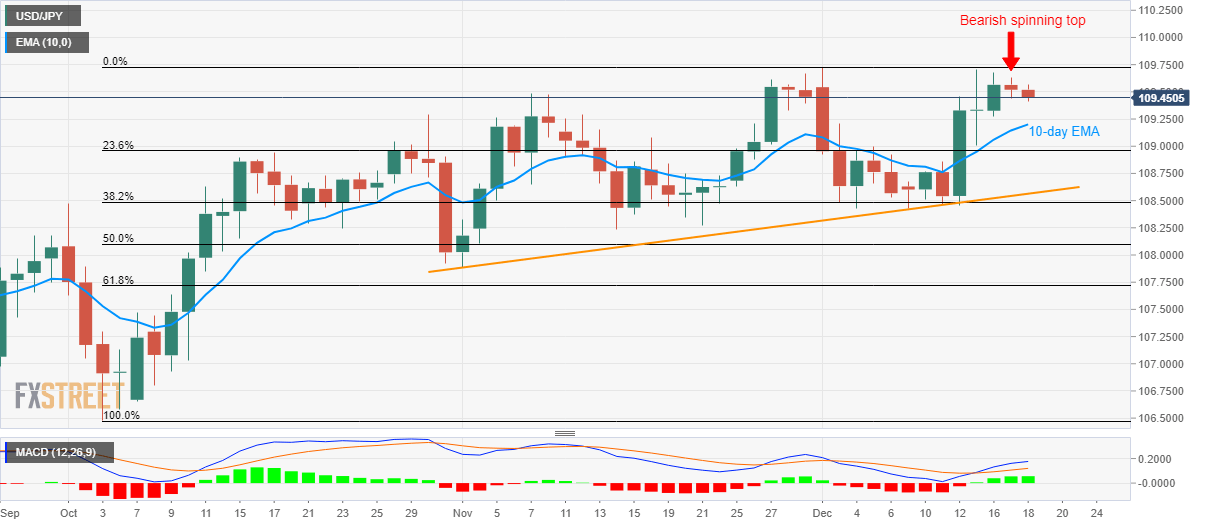
The quote seems to extend the fall towards a 10-day Exponential Moving Average (EMA) level of 109.20 whereas 23.6% Fibonacci retracement of October-December upside, at 108.95, can please sellers afterward.
Should prices drop after 108.95, an ascending trend line since early November and 38.2% Fibonacci retracement can entertain the bears around 108.55 and 108.48 respectively.
Meanwhile, the pair’s upside clearance of 109.75 needs validation from 110.00 to lure buyers. In doing so, May month high surrounding 110.70 will be on their radars.
USD/JPY daily chart
Trend: Pullback expected
