- GBP/USD pauses two-day-old declines around 21-DMA.
- Bearish MACD, a sustained trading below key trend line keep sellers hopeful.
- 23.6% Fibonacci retracement, Monday’s low add to the resistances.
GBP/USD holds on to its recovery from 21-Day Simple Moving Average (DMA) while taking the bids to 1.3080 during early Thursday. That said, the pair dropped below the 10-week-old rising trend line the previous day.
With the bearish signals from 12-bar Moving Average Convergence and Divergence (MACD) joining the pair’s sustained trading below the previous support line, prices are likely to extend declines. In doing so, October month high near 1.3010 and 38.2% Fibonacci retracement of September-December upside, at 1.2915, will become sellers’ targets.
Assuming the pair’s extended downpour below 1.2915, the quote can revisit November month lows near 1.2770.
Alternatively, pair’s rise beyond the support-turned-resistance, at 1.3125 now, will have to cross 23.6% Fibonacci retracement level of 1.3145 to meet Monday’s low around 1.3320.
During the pair’s extended rise above 1.3320, 1.3425 and the recent high near 1.3515 will be the key to watch.
GBP/USD daily chart
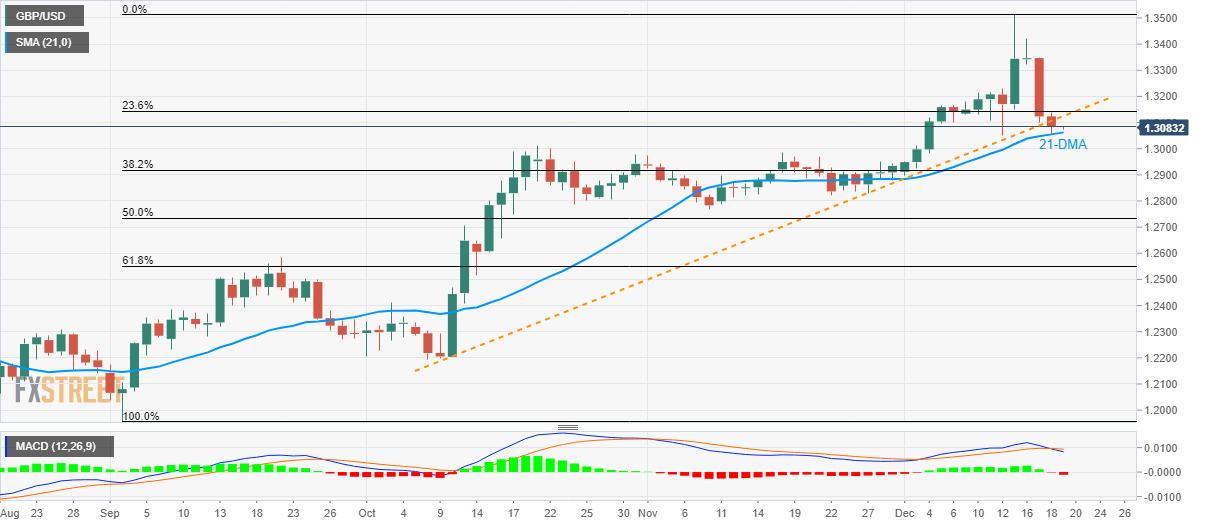
Trend: Pullback expected
