- Gold stalls the previous two day’s declines.
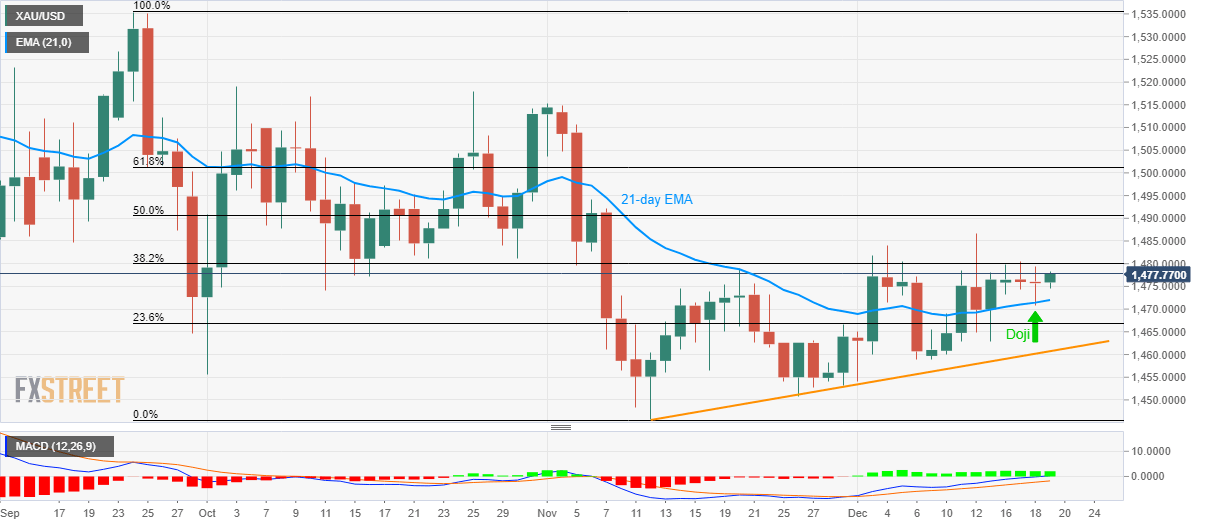
- A daily closing beyond 38.2% Fibonacci retracement will extend the recent recovery.
- The five-week-old ascending trend line can continue challenging sellers after 21-day EMA.
Gold prices pause the previous two-day declines while taking the bids to $1477.80 during early Thursday. The safe-haven metal trades successfully beyond 21-day Exponential Moving Average (EMA) wherein Wednesday’s bullish Doji formation on the daily chart indicates further recovery.
Even so, 38.2% Fibonacci retracement of late-September to early-November fall, at $1,480, seems to limit the bullion’s immediate upside.
A daily closing past-38.2% Fibonacci retracement can accelerate the yellow metal’s recovery towards 50% Fibonacci retracement level of $1,490 and November 06 high of $1,494 ahead of highlighting $1,500 to buyers.
Meanwhile, sellers will look for entry below the 21-day EMA level of $1,472. In doing so, 23.6% Fibonacci retracement, at $1,466.80, could become their immediate target.
However, an upward sloping trend line since November 12, at $1,460.70, will question the commodity’s further declines below $1,466.80.
Gold daily chart
Trend: Recovery expected
