- EUR/USD fails to hold onto the previous day’s recovery.
- 200-bar SMA, 61.8% Fibonacci retracement becomes the key support confluence.
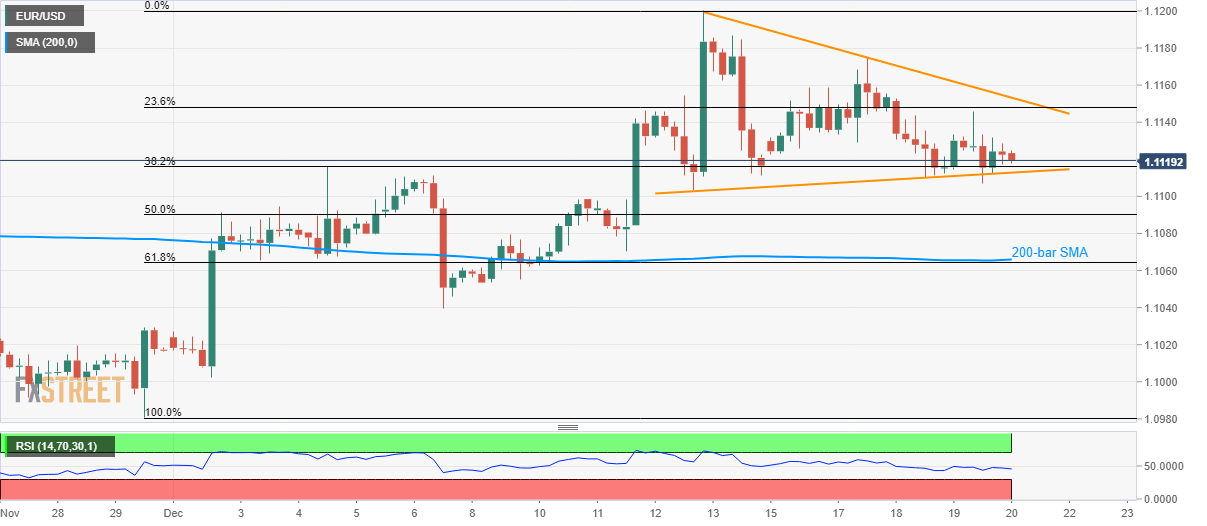
EUR/USD declines to 1.1118, while also staying inside the one-week-old symmetrical triangle, during early Friday.
The pair’s recent gradual weakness will find it hard to slip beneath the formation support of 1.1110, a break of which could escalate the fall towards 50% Fibonacci retracement of late-November to the early-December upside, at 1.1090.
However, a confluence of 200-bar Simple Moving Average (SMA) and 61.8% Fibonacci Retracement, bear 1.1066/64, will become a tough nut to crack for sellers after 1.1090.
On the contrary, 23.6% Fibonacci retracement, at .1148 and triangle’s resistance line around 1.1153 can cap pair’s immediate upside.
Should there be a sustained rise beyond 1.1153, 1.1200 and August month top nearing 1.1250 Will gain the Bull’s attention.
EUR/USD four-hour chart
Trend: Sideways
