- NZD/USD repeatedly fails to clear weekly horizontal resistance.
- NZ Credit Card Spending For November came in below expectations, above prior.
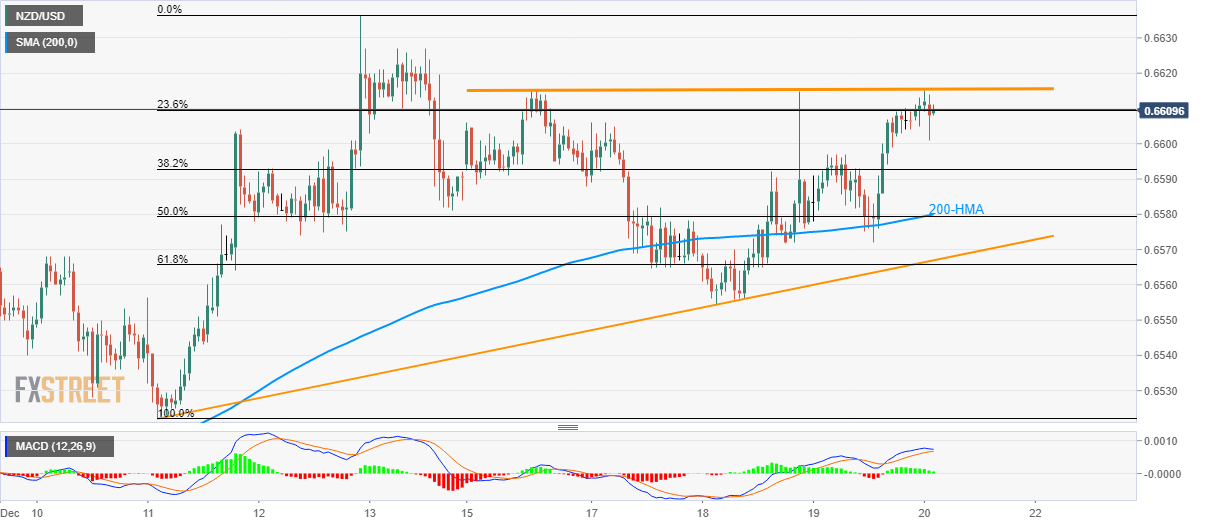
- 200-HMA, 50% Fibonacci retracement offers a strong nut to crack for sellers.
With the mixed reaction to the recently published New Zealand data, NZD/USD seesaws around 0.6610 during early Friday.
New Zealand’s (NZ) November month Credit Card Spending (YoY) slip below 5.0% forecast to 4.5% but still held above downwardly revised 2.3% (actual prior was 2.5%).
A week-long horizontal resistance around 0.6615/16 has been restricting the pair’s upside off-late.
With this, the pair is expected to witness a pullback towards a confluence of 200-Hour Simple Moving Average (HMA) and 50% Fibonacci Retracement of December 11-12 upside, at 0.6580.
Though, pair’s further declines will be restricted by the seven-day-old rising support line and 61.8% Fibonacci retracement, close to 0.6565.
Meanwhile, a sustained upside beyond 0.6615 enables the pair to challenge the monthly high surrounding 0.6636 while its further rise can aim for an early-July low near 0.6655.
NZD/USD hourly (H1) chart
Trend: Pullback expected
