- DXY stops the early-week recovery after bearish candlestick formation.
- 200-DMA offers an additional upside barrier.
US Dollar Index (DXY) clings to 97.42 while heading into the European session on Friday. The greenback gauge registered a bearish candlestick formation on Thursday. Further, 12-bar Moving Average Convergence and Divergence (MACD) also flashes bearish signals.
With this, the index is likely to revisit 97.00 mark while the monthly bottom surrounding 96.72 will be on sellers’ radar afterward.
The bearish candlestick formation gets negated if the quote rallies beyond 97.50. Even so, 200-Day Simple Moving Average (DMA) around 97.70 could restrict further advances.
It should, however, be noted that a daily closing beyond 97.70 enables the bulls to aim for November month tops close to 98.50.
DXY daily chart
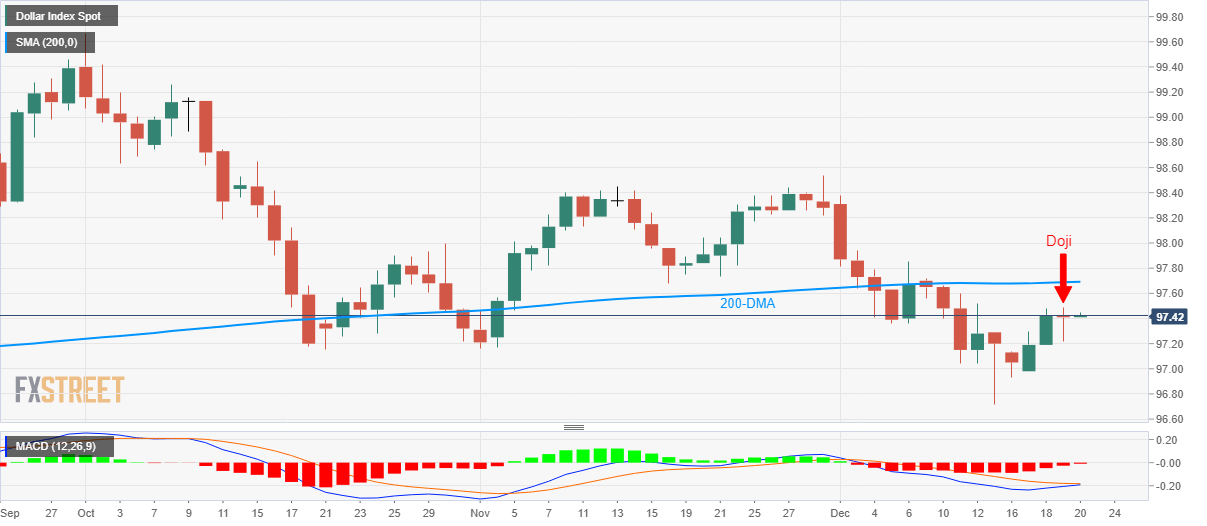
Trend: Bearish
