- USD/INR steps back from a two-week high.
- Recovery from 50% Fibonacci retracement rejected by the key DMAs.
- A descending trend line since mid-November adds to resistance.
Given the confluence of 50 and 100-Day Simple Moving Averages (DMA) restrict near-term upside of the USD/INR pair. The quote declines to 71.07 during the pre-European session on Friday.
The quote now declines towards 38.2% Fibonacci retracement of July-September upside, at 70.95, while 50% Fibonacci retracement level and September month bottom, near 70.45 and 70.36 respectively.
Should prices fail to bounce off 70.36, the 61.8% Fibonacci retracement of 69.92 will lure the bears.
On the contrary, the pair’s daily closing beyond 71.25/30 area could propel it to a short-term falling resistance line, at 71.63.
Though, a sustained break of 71.63 might not refrain from challenging 72.00 round-figure whereas November month high near 72.40 will be aimed then after.
USD/INR daily chart
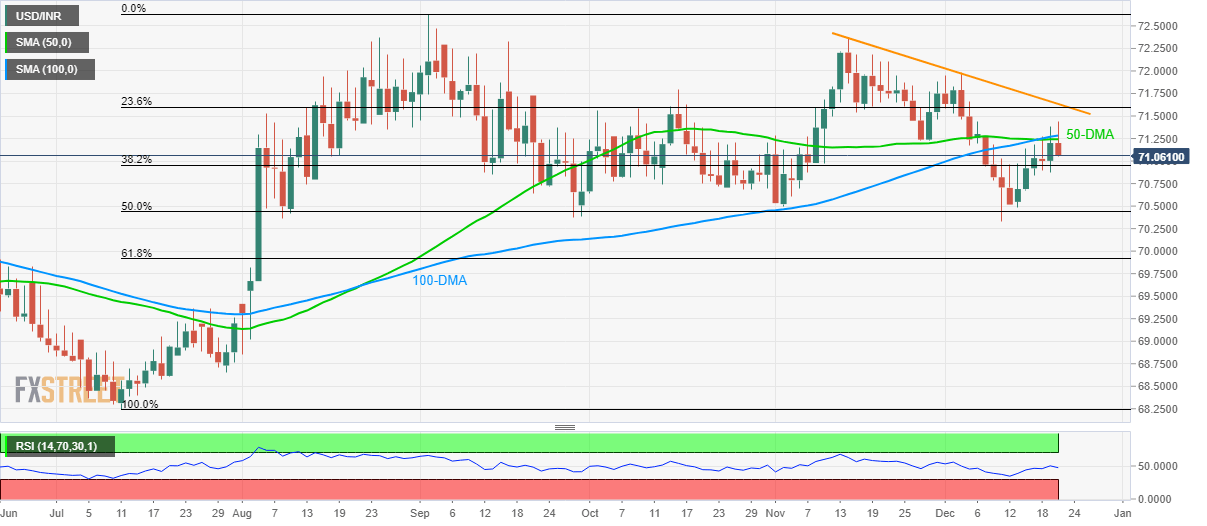
Trend: Pullback expected
