- USD/MXN trades well below 200-week SMA, 16-month-old rising trend line.
- Bearish MACD favors the further downside.
Having breached key support confluence (now resistance) USD/MXN declines to 18.9377 during early Friday.
The pair sustained its break of 200-week Simple Moving Average (SMA) and an upward sloping trend line since August 2018. Adding to the downside bias are bearish signals from 12-bar Moving Average Convergence and Divergence (MACD).
With this, the quote is likely to extend its downward trajectory towards the yearly low of 18.7434 whereas 23.6% Fibonacci retracement of its January-July 2017 fall, near 18.5325, can entertain the bears afterward.
On the upside, prices need to provide a weekly closing beyond 1.0500 support-turned-resistance line to aim for late-November highs surrounding 19.65 and 20.00 round-figure.
USD/MXN weekly chart
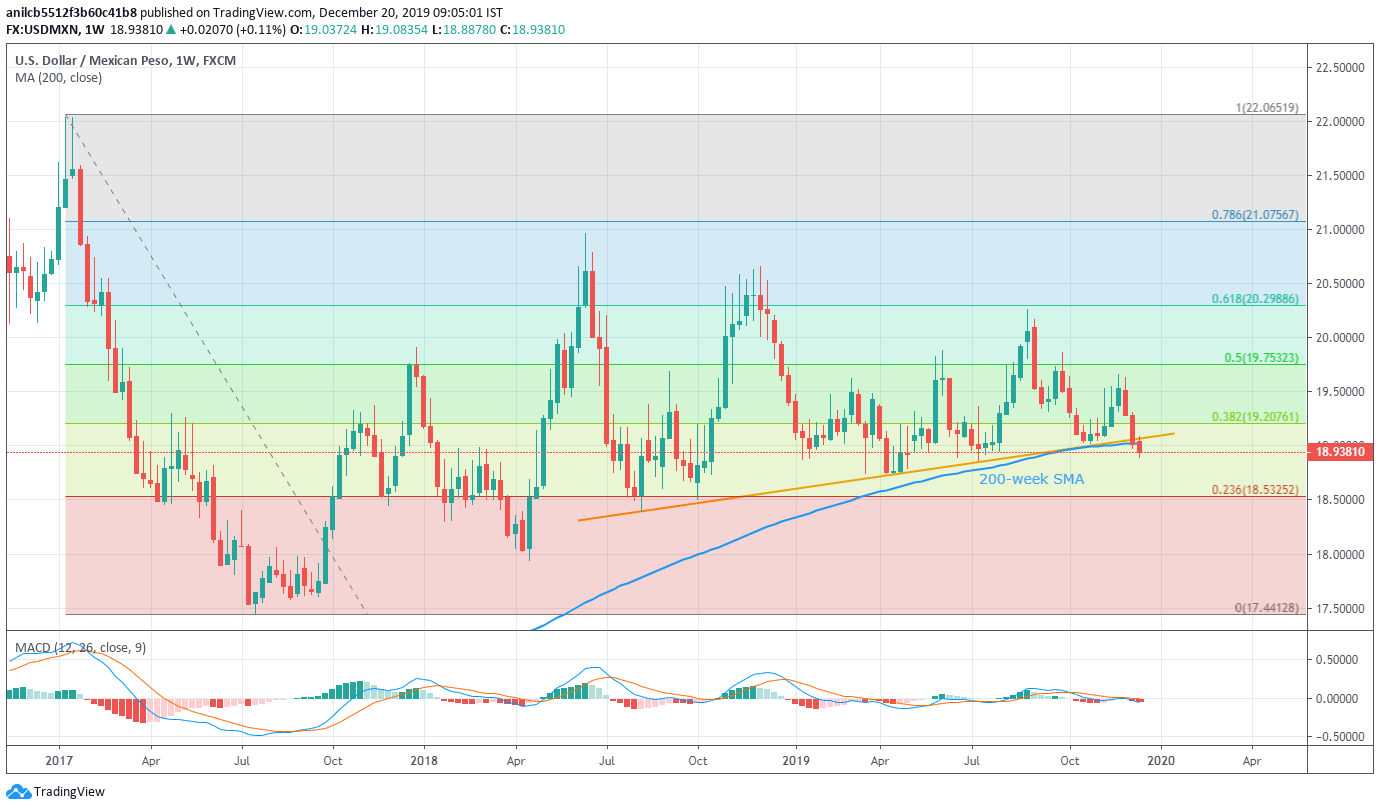
Trend: Bearish
