- USD/IDR struggles around 23.6% Fibonacci retracement of December 03-12 declines, formation support.
- An upside break of the triangle needs validation from 200-bar SMA.
USD/IDR trades around 13,977 during the pre-European session on Monday. In doing so, the pair pulls back from 23.6% Fibonacci retracement while also defying the latest bounce off the 13-day-old falling triangle.
The bullish technical formation gets confirmation on the upside break of 14,023. However, 200-bar Simple Moving Average (SMA), near 14,055, will question buyers.
If at all prices manage to stay firm beyond 14,055, 14,100 and the monthly top nearing 14,173 will be on the Bull’s radar.
Meanwhile, pair’s declines below the pattern’s support of 13,958 could recall the month’s low near 13,925.
However, lows marked in September and July, close to 13,880 will restrict the quote’s downside past-13,925.
USD/IDR four-hour chart
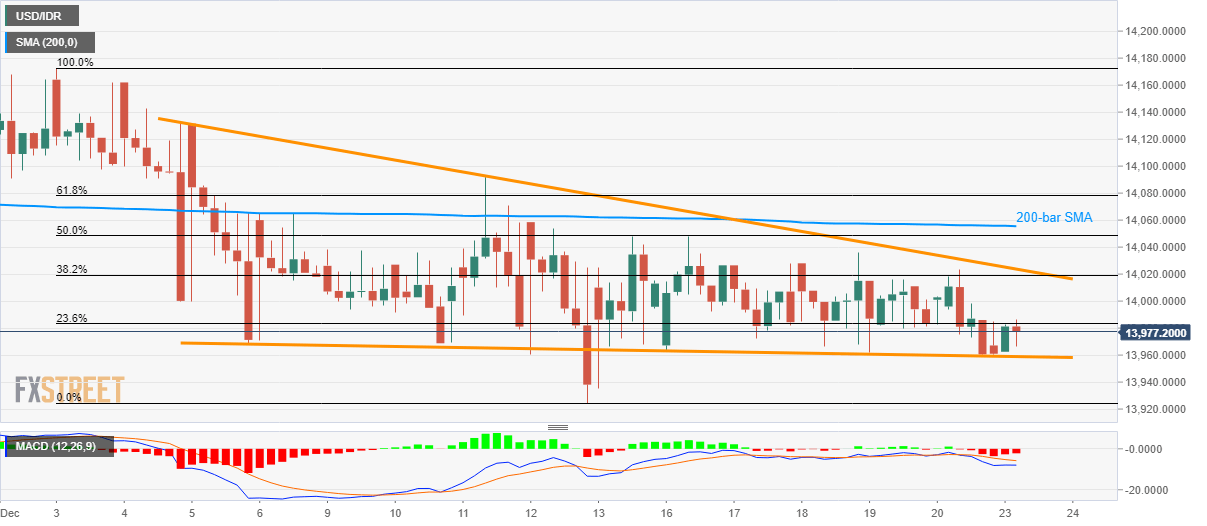
Trend: Sideways
