- EUR/USD pulls back amid bearish MACD after flashing a bearish candlestick formation during the previous day.
- 38.2% Fibonacci, 100-DMA are immediate supports on sellers’ radar.
- Bulls await a clear break of 200-DMA to question the monthly top.
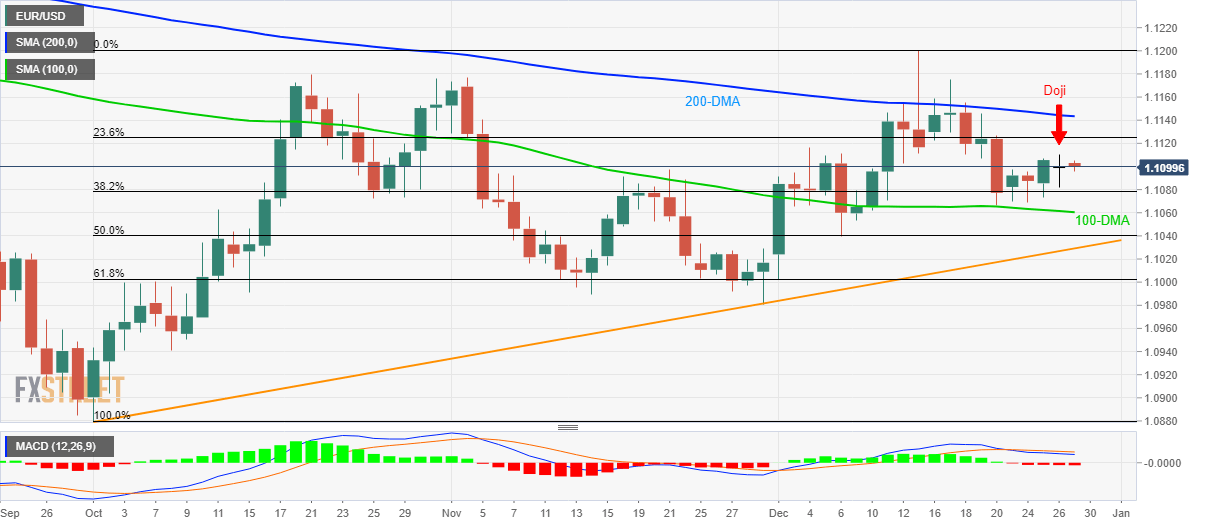
Having registered a bearish Doji candlestick formation on a previous day, EUR/USD steps back to 1.1100 during early Friday.
In addition to the bearish candlestick, 12-bar Moving Average Convergence and Divergence (MACD) also indicates bearish signals. As a result, sellers may look for entry targeting 38.2% Fibonacci retracement level of October-December upside, at 1.1078.
However, pair’s declines below 1.1078 are likely to be challenged by 100-Day Simple Moving Average (DMA) near 1.1060.
If at all bears refrain from respecting 1.1060, an ascending trend line since early-October, at 1.1030 now, will be the key to watch.
On the upside, 23.6% Fibonacci retracement level of 1.1125 offers immediate resistance to the pair ahead of the 200-DMA level of 1.1145.
In a case where prices manage to cross 1.1145 on a daily closing basis, the monthly high of 1.1200 will be on the bulls’ watch-list.
EUR/USD daily chart
Trend: Pullback expected
