- USD/CAD stays below 23.6% Fibonacci retracement of June-July downpour, inside a five-month-old symmetrical triangle.
- 61.8% Fibonacci retracement adds to the resistance beyond the triangle formation.
USD/CAD test 1.3100 mark while heading into the European open on Friday. The pair has recently reversed from the confluence of 21 and 50-Day Simple Moving Average (DMA) and slipped beneath 23.6% Fibonacci retracement of June-July fall.
The pair now aims to visit the support line of the mentioned symmetrical triangle, at 1.3055 now. However, likely oversold conditions of 14-day Relative Strength Index (RSI) should trigger the pair’s bounce from there, if not then October lows near 1.3040 will be in the spotlight.
If at all there prevails a weakness in the price below 1.3040, July month low around 1.3015 and 1.3000 could lure the bears.
Alternatively, 23.6% Fibonacci retracement of 1.3145 offers immediate resistance to the pair ahead of 21/50-DMA confluence near 1.3185/90.
Given the bulls’ ability to cross 1.3190, 50% Fibonacci retracement and the triangle resistance, near 1.3290 and 1.3310, could return to the charts.
USD/CAD daily chart
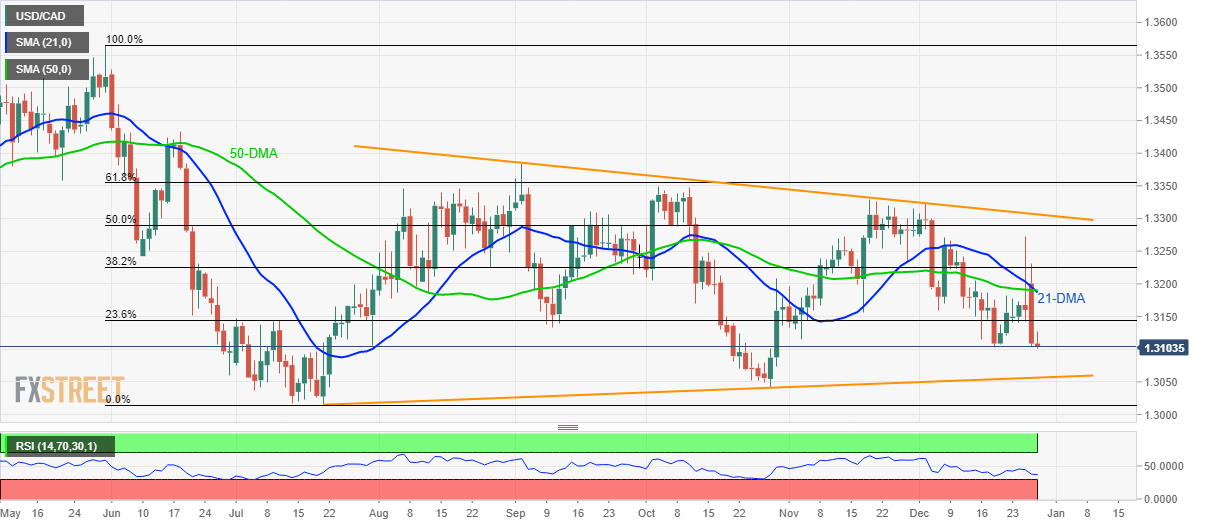
Trend: Bearish
