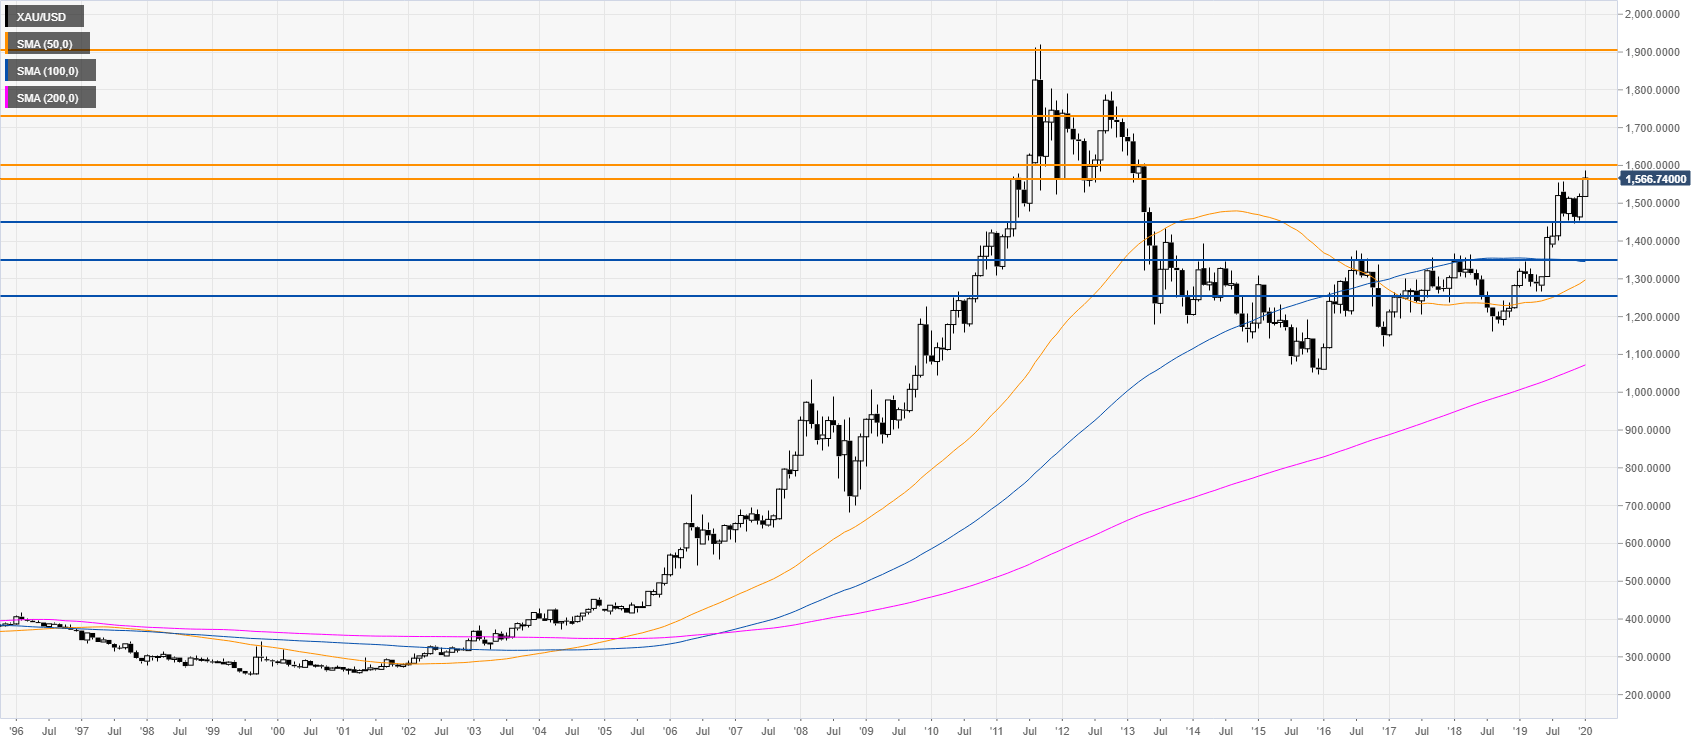
- The 2019 uptrend is rolling into 2020.
- The level to beat for buyers is the 1560/1600 price zone.
Gold monthly chart
The gold market is trading in an uptrend above the main monthly simple moving averages (SMAs). The metal is trying to have a convincing breakout above the 1560/1600 price zone. If the bulls can break this crucial resistance zone, gold can climb to the 1730 and 1900 resistance levels.
Gold daily chart
In the event, buyers fail to overcome the 1560/1600 resistance zone and it gets strongly rejected, the market could drop to 1445 support with a potential correction down to the 1350 and 1250 levels.
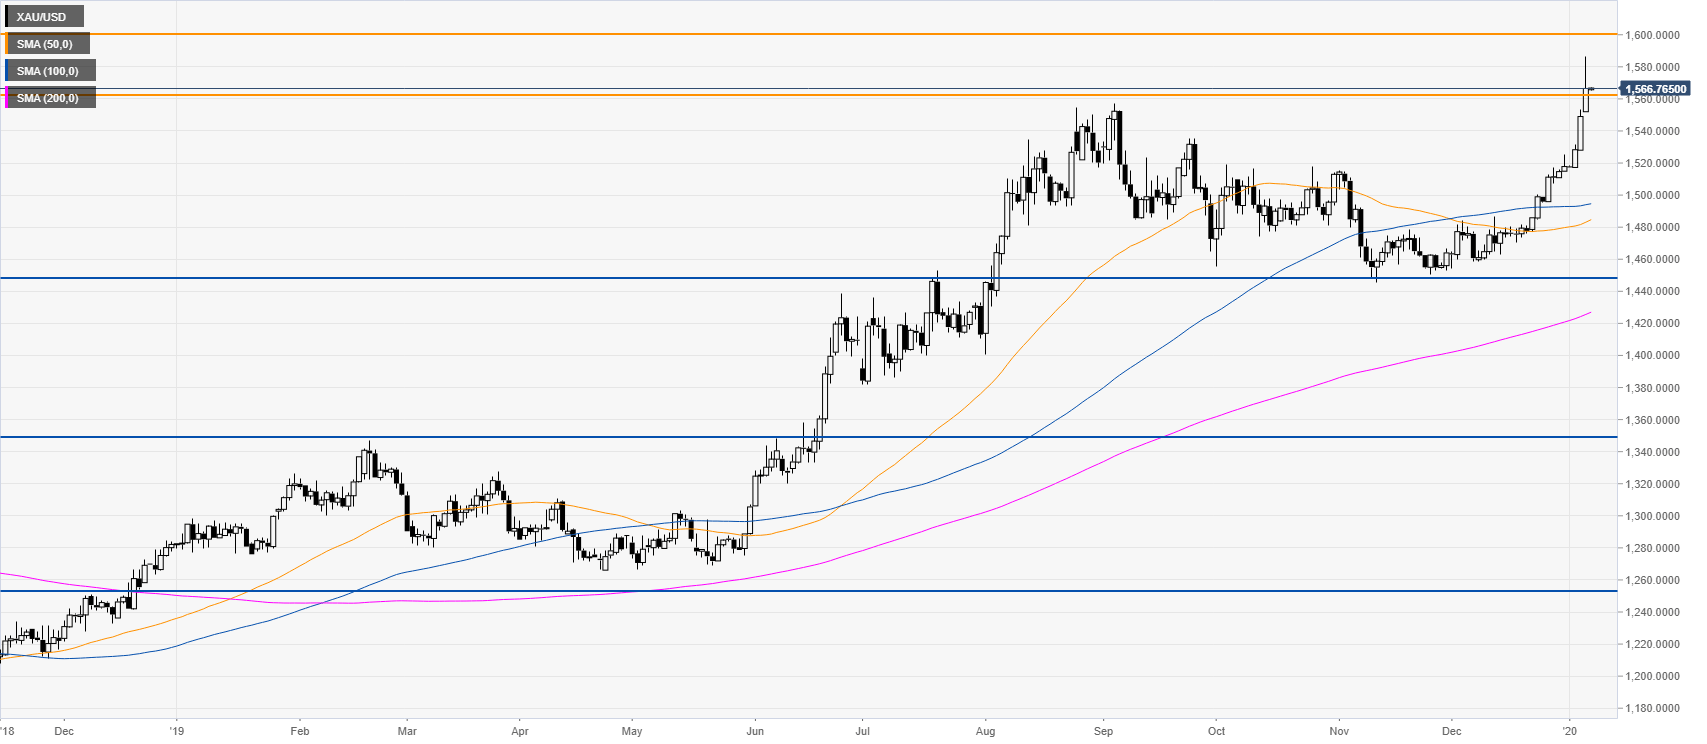
Additional key levels
