- AUD/JPY trades near four-week low after breaking multi-month-old support line and 200-day SMA.
- 100-day SMA gains sellers’ attention ahead of mid-November bottom.
- Buyers will refrain from entry unless prices stay strong beyond 200-day SMA.
AUD/JPY remains on the back foot around the monthly low while trading around 74.50 amid the early Asian session on Wednesday. That said, the pair dropped below 200-day SMA and an upward sloping trend line since October 10 during the previous day while taking a U-turn from 75.28.
Considering the break of the near-term key support line and failure to stay above 200-day SMA, not to forget bearish signals from 12-bar MACD, AUD/JPY prices are likely to extend their recent fall.
In doing so, a 100-day SMA level of 73.96 will be the first on the sellers’ radar, a break of which could drag the quote further south to November 14 low of 73.35.
Meanwhile, buyers will wait for a sustained trading past-200-day SMA level of 74.91, with the support-turned-resistance line at 74.73 acting as an immediate upside barrier.
It’s worth mentioning that early-December highs and the year-end lows together signal 76.00 as the key resistance during the pair’s rise above 74.91.
AUD/JPY daily chart
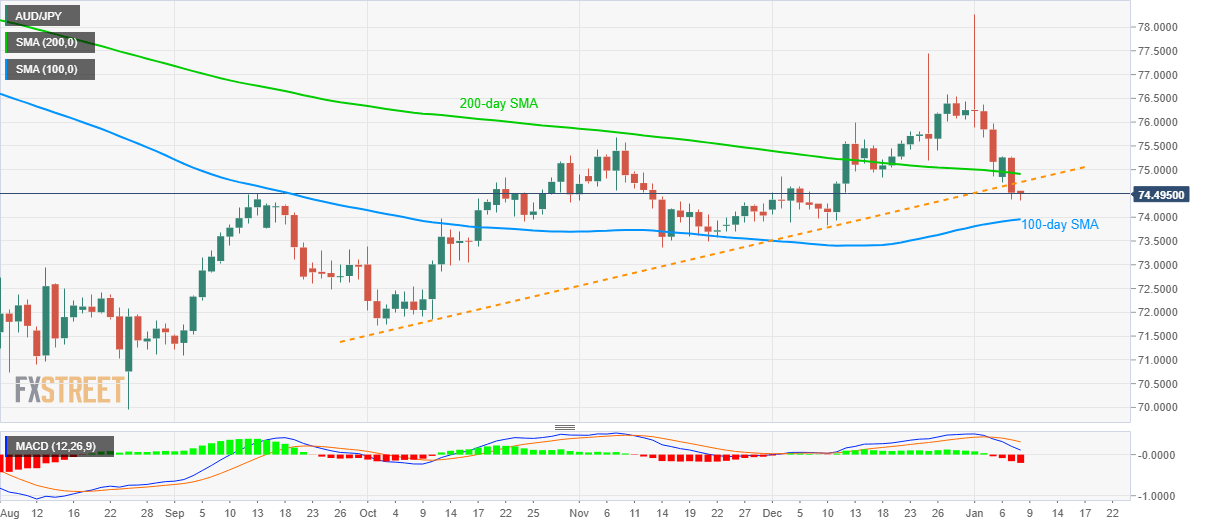
Trend: Bearish
