- EUR/USD is under selling pressure below the 1.1160 resistance.
- The level to beat for bears is the 1.1142/1.1129 support zone.
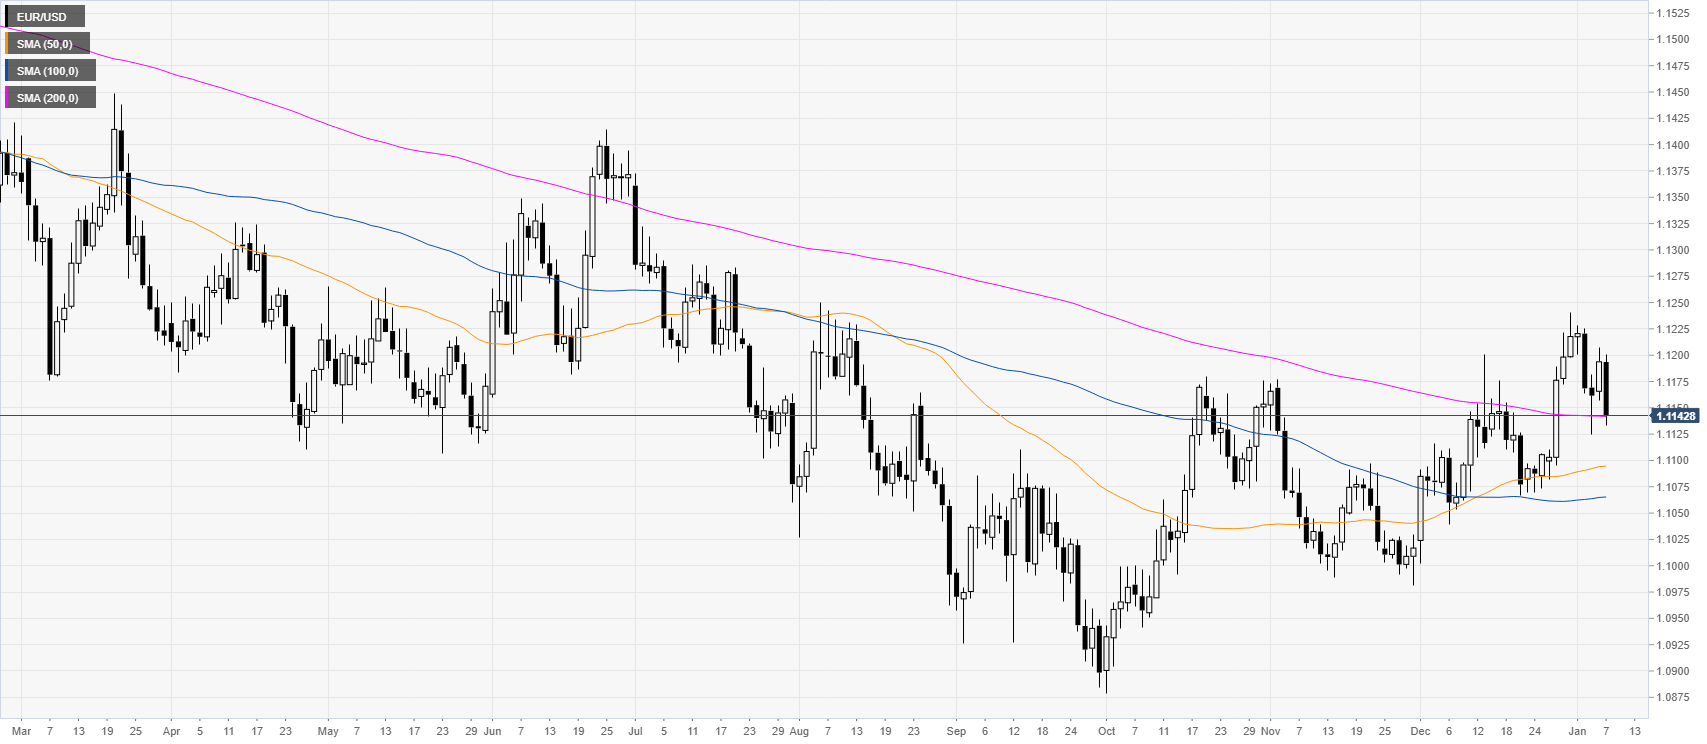
EUR/USD daily chart
The market is correcting down just above the 200-day simple moving average (SMA) as the market is easing from the December 2019 highs.
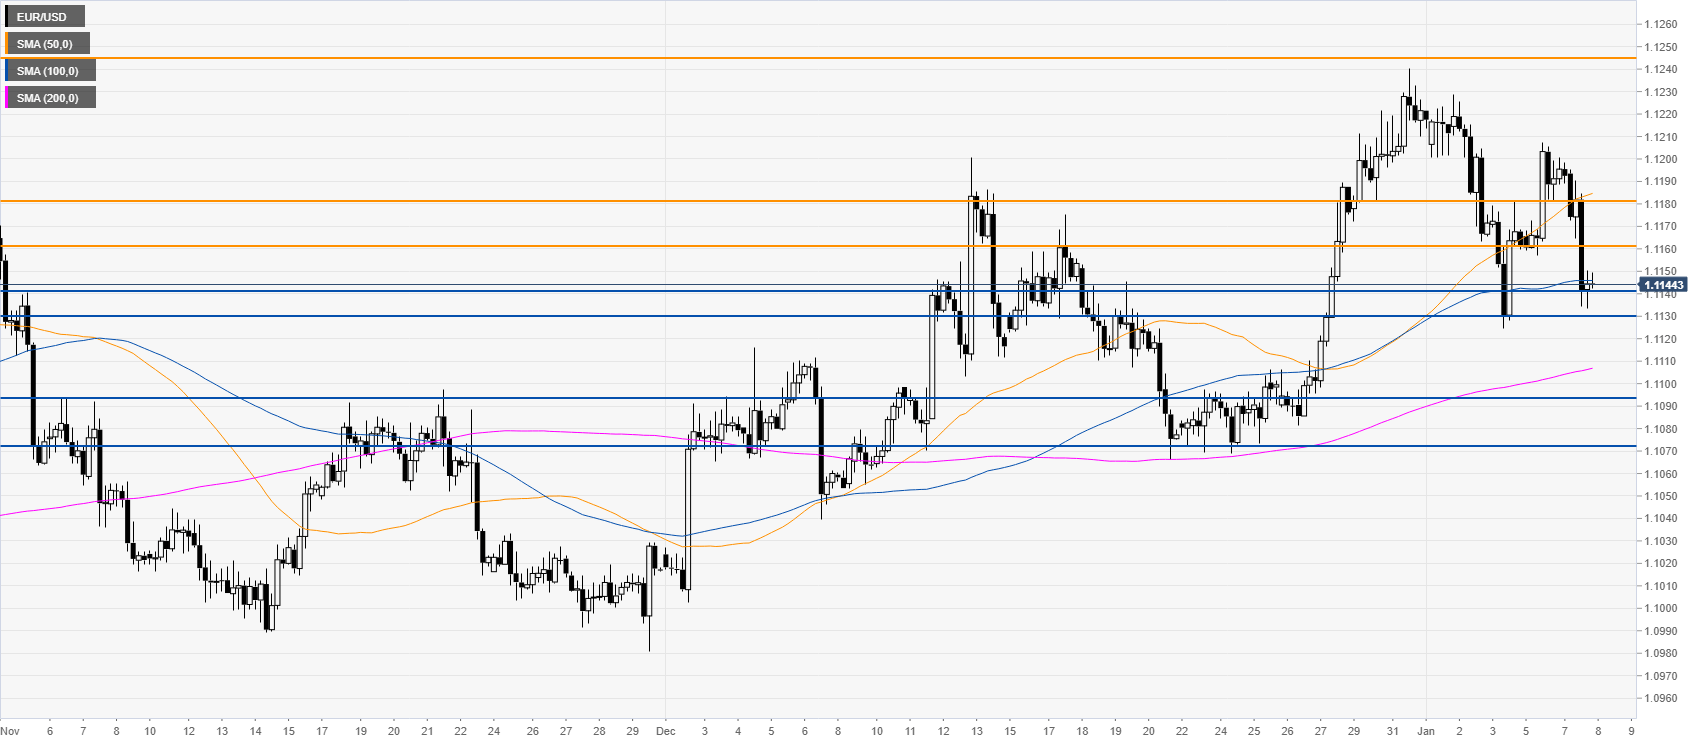
EUR/USD four-hour chart
EUR/USD is challenging the 1.1142/1.1129 support zone near the 100 SMA. Bears will probably look for a breakdown below this zone and potentially set sail towards the 1.1094 and 1.1071 price levels. Resistances are seen near the 1.1160 and 1.1187 price levels. A breakout above the latter could generate a bullish break to the 1.1245 resistance, according to the Technical Confluences Indicator.
Additional key levels
