- EUR/USD is under bearish pressure 1.1142/1.1129 price zone.
- The next support is seen near the 1.1094 level.
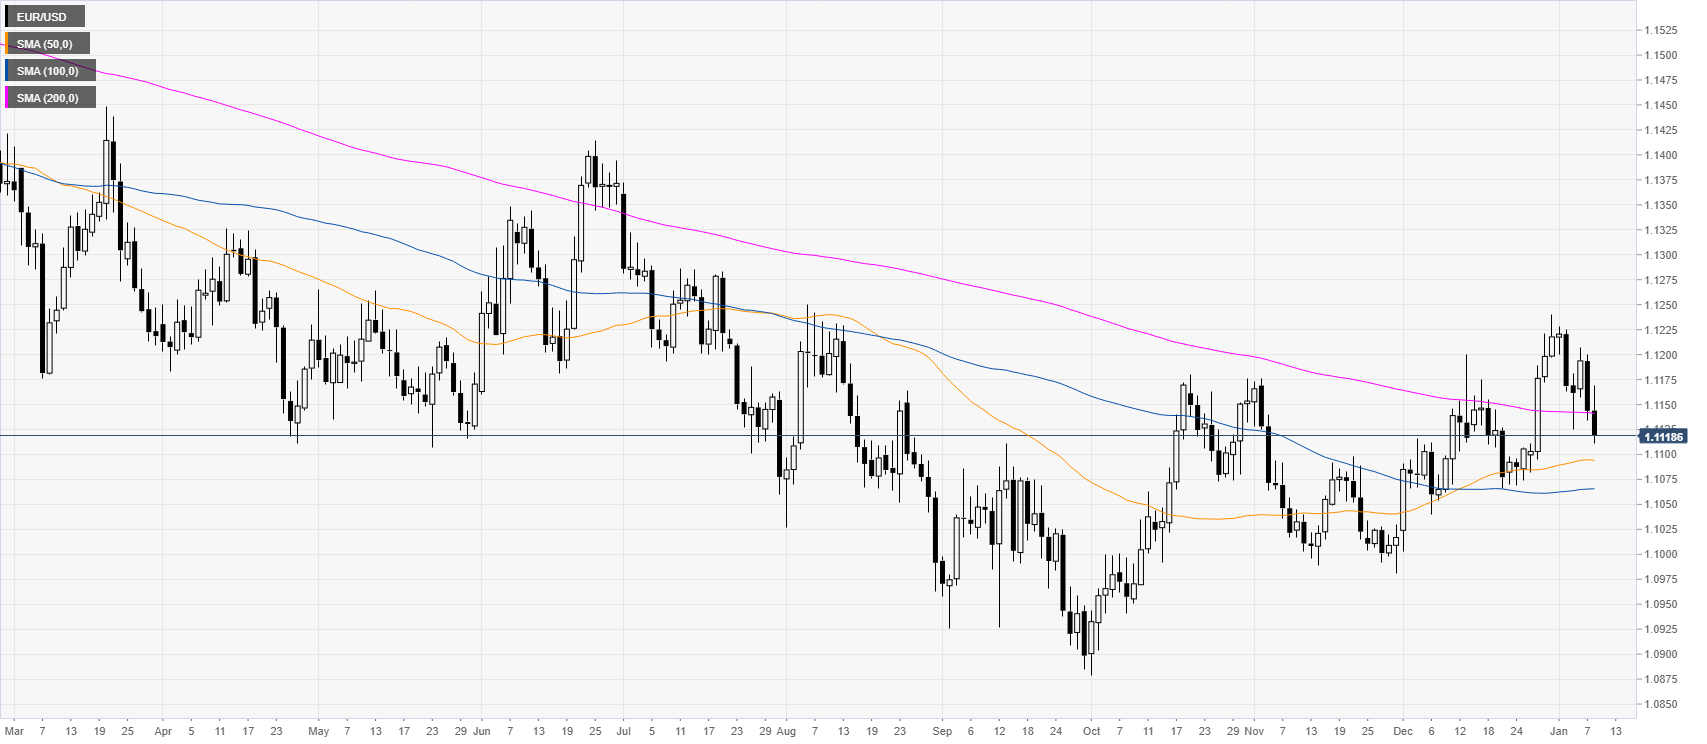
EUR/USD daily chart
The market is correcting below the 200-day simple moving average (SMA) as the market is easing from the December 2019 tops.
EUR/USD four-hour chart
EUR/USD broke below the 1.1142/1.1129 price zone and is nearing the 200 SMA on the four-hour chart. Bears will probably look for a continuation down towards the 1.1094 and 1.1071 price levels. Resistances are seen near the 1.1160 and 1.1187 price levels. The 1.1142/1.1129 price zone is turning resistance, according to the Technical Confluences Indicator.
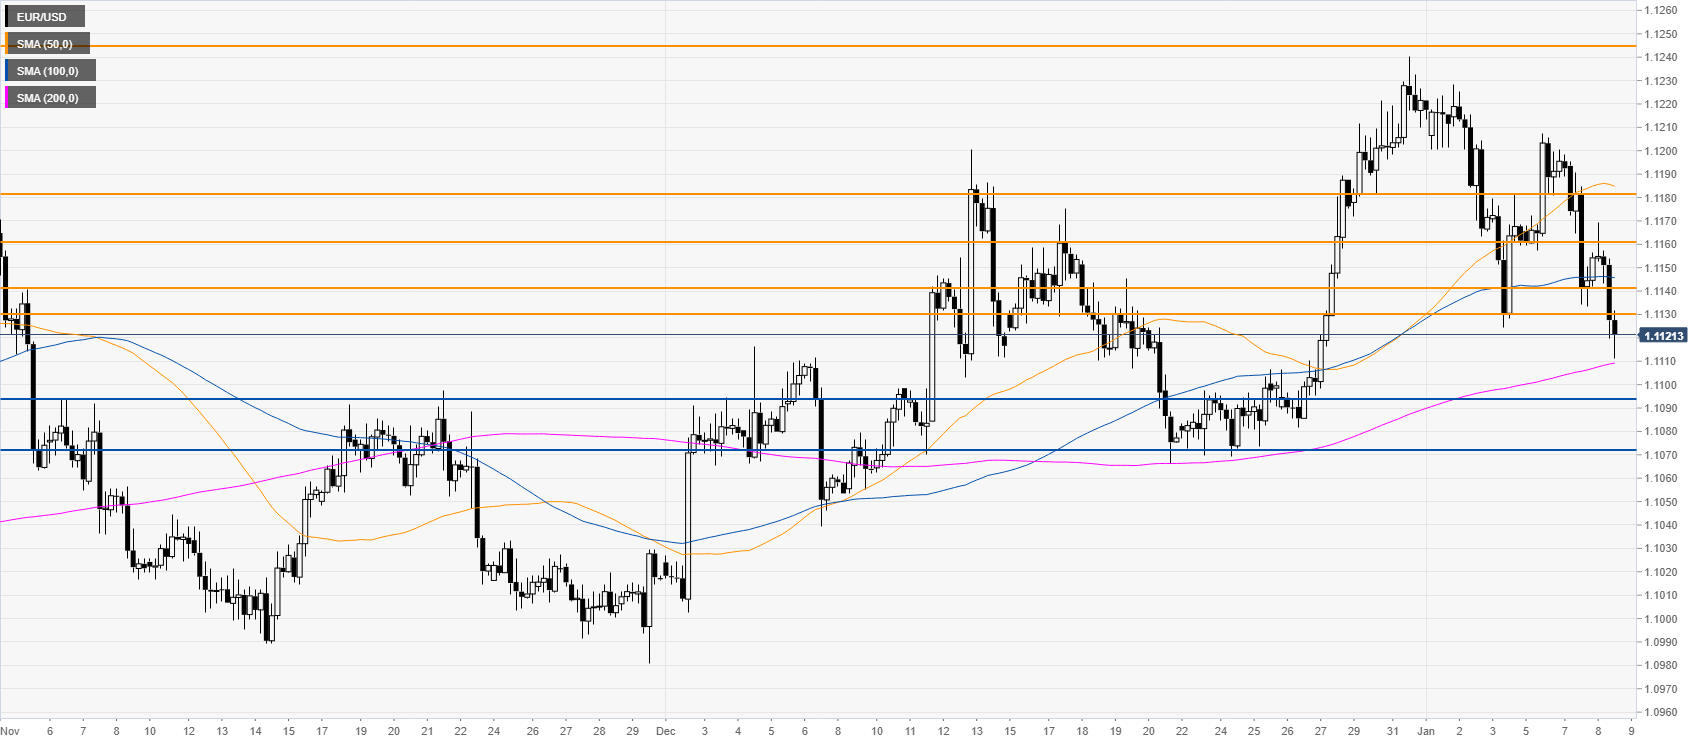
Additional key levels
