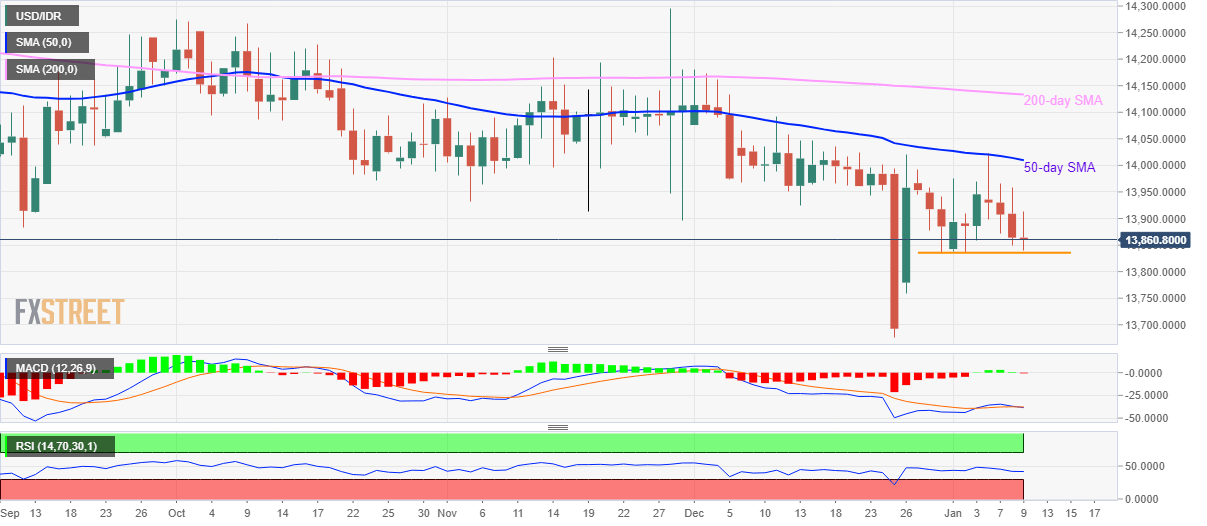
- USD/IDR remains on the back foot while extending declines from 50-day SMA.
- Lows marked since late-December 31 hold the keys to further downside.
USD/IDR remains under pressure while taking rounds to 13,860 ahead of the European session on Thursday. The pair took a U-turn from 50-day SMA during the week’s start. Even so, lows marked on December 31 and January 02 offer immediate support around 13,837/35.
As a result, sellers will look for entry below 13,835 while targeting the 13,750 and 13,680 numbers to the south.
Meanwhile, the pair’s weakness can’t be ruled out unless it registers a daily closing beyond a 50-day SMA level of 14,010.
In doing so, the 200-day SMA level of 14,133 will become buyers‘ favorite ahead of Octobre month tops surrounding 14,275.
It’s worth mentioning that the sluggish conditions of RSI and MACD indicators portray a lesser likelihood of wild moves.
USD/IDR daily chart
Trend: Pullback expected
