- Gold prices fail to hold onto Friday’s recovery gains.
- 23.6% of Fibonacci retracement limits immediate upside.
- December-end top, 61.8% Fibonacci retracement offers strong support.
Gold drops to $1556 during early Monday. In doing so, the yellow metal negates the previous day’s bounce off the near-term key support line.
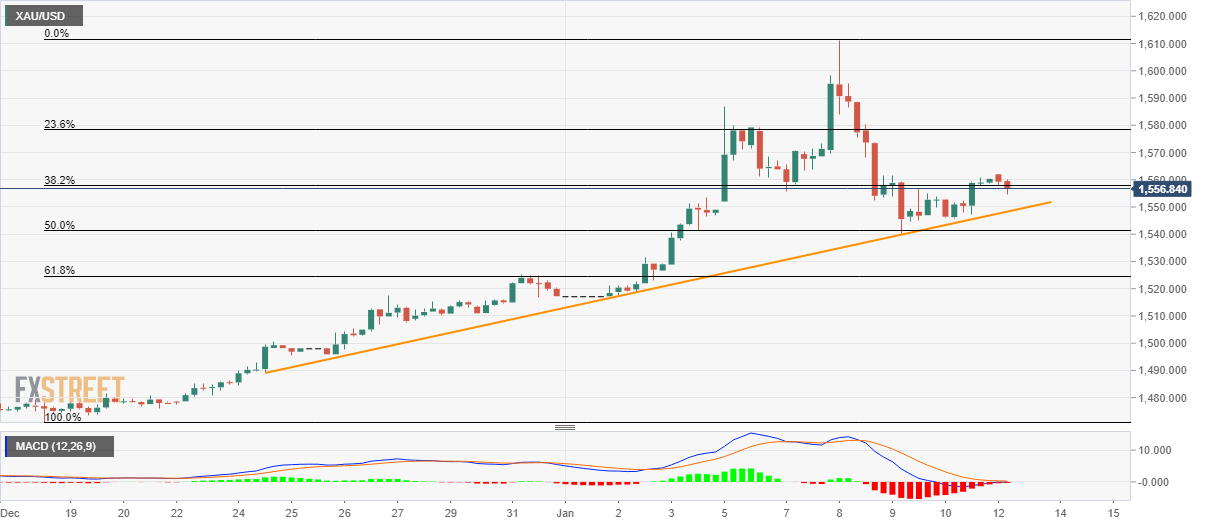
As a result, sellers will look for the break of rising trend line since December 24, at $1,548 now, for fresh entry targeting 50% Fibonacci retracement of the bullion’s rise from December 18 to January 08, around $1,540.
During the quote’s declines past-$1,540, a confluence of 2019-end high as well as 61.8% Fibonacci retracement will challenge the Bears around $1,525.
Alternatively, 23.6% Fibonacci retracement of $1,578 holds the key to the precious metal’s rise to $1,600 and then towards challenging the multi-year top of $1,611.
Gold four-hour chart
Trend: Bullish
