- AUD/JPY extends losses amid bearish MACD signals.
- Buyers will look for entry beyond the three-week-old falling trend line.
AUD/JPY declines to 75.70 during the initial Asian session on Monday. That said, the pair has been weaker since taking a U-turn from 76.25 on late-Thursday. The sellers also cheer bearish signals from the 12-bar MACD indicator.
As a result, 61.8% Fibonacci retracement of the pair’s declines from December 27 to January 08, at 75.50, gains the bears’ immediate attention. However, 200-bar SMA and highs marked on January 03 and 07 could restrict pair’s further downside around 75.27/25.
If at all AUD/JPY prices keep trading southwards past-75.25, 75.00 and 23.6% Fibonacci retracement near 74.40 will be in the spotlight.
On the upside, a downward sloping trend line since December 27, near 76.25 now, will keep the pair’ under pressure, a break of which could fresh monthly high to 76.55.
AUD/JPY four hour chart
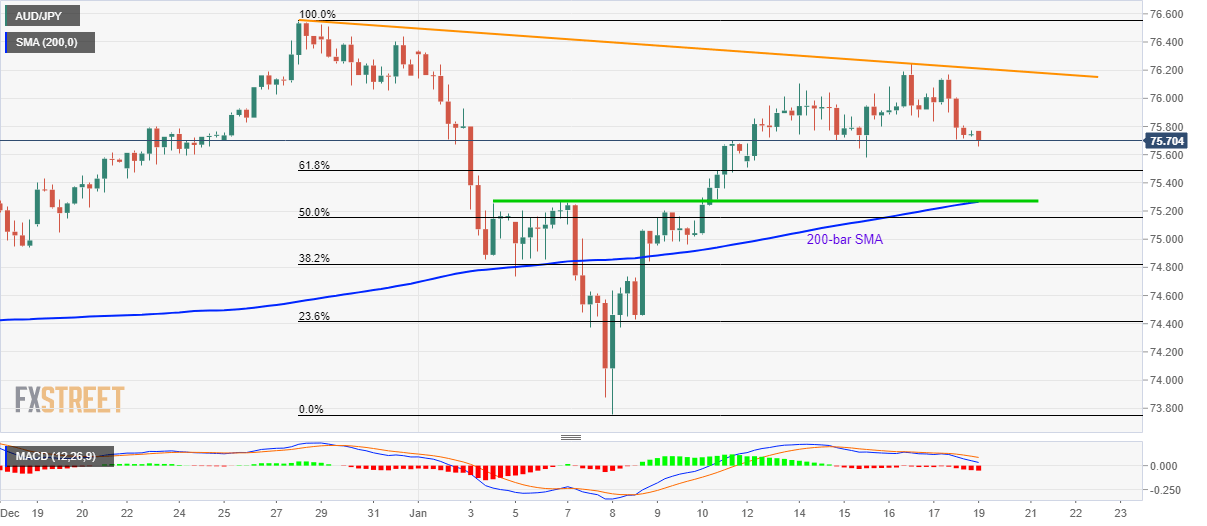
Trend: Pullback expected
