- AUD/USD recovers after two days of declines.
- Monthly bottom, 23.6% Fibonacci retracement offer additional barriers to the momentum.
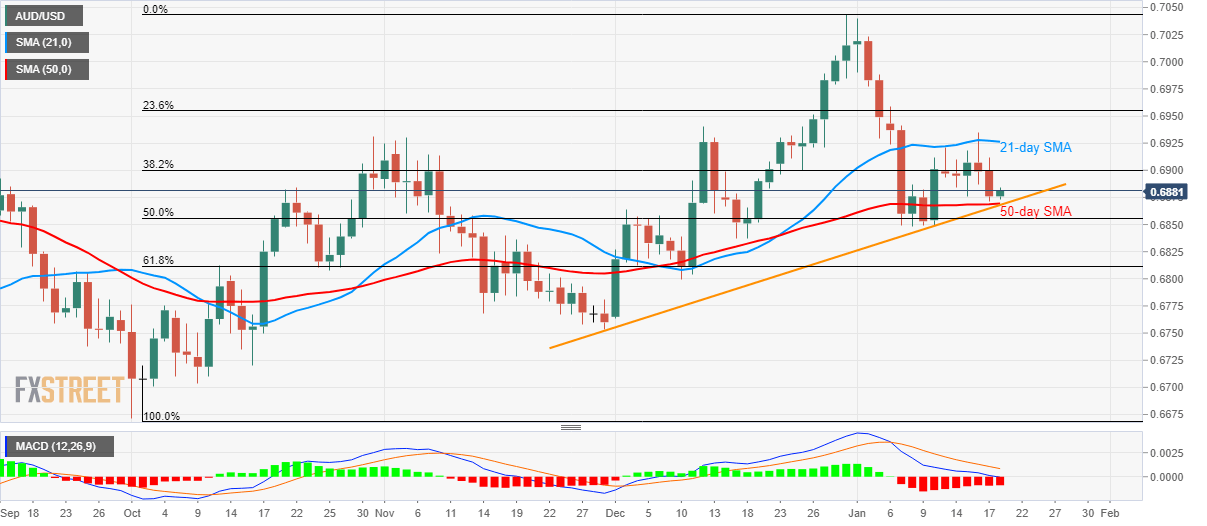
AUD/USD bounces off 0.6873 to the intra-day high of 0.6884 by the press time early Monday. The pair is close to the short-term support confluence comprising 50-day SMA and an upward sloping trend line stretched from November 29.
While 0.6870 seems to be the tough nut to crack for sellers, a downtick below the same, as suggested by the bearish MACD, might not refrain from declining below the monthly low of 0.6848.
In doing so, 61.8% Fibonacci retracement of October-December upside, at 0.6810, will entertain sellers ahead of 0.6800 round-figure.
Alternatively, a 21-day SMA level of 0.6926 and 23.6% Fibonacci retracement near 0.6955 can please buyers during the pair’s further recovery.
However, 0.7000 and the monthly high near 0.7040/45 can keep the bulls challenged afterward.
AUD/USD daily chart
Trend: Pullback expected
