- EUR/GBP extends recovery gains amid bullish MACD.
- 100-day EMA adds to resistance.
- Five-week-old rising trend line could question sellers below 21-day EMA.
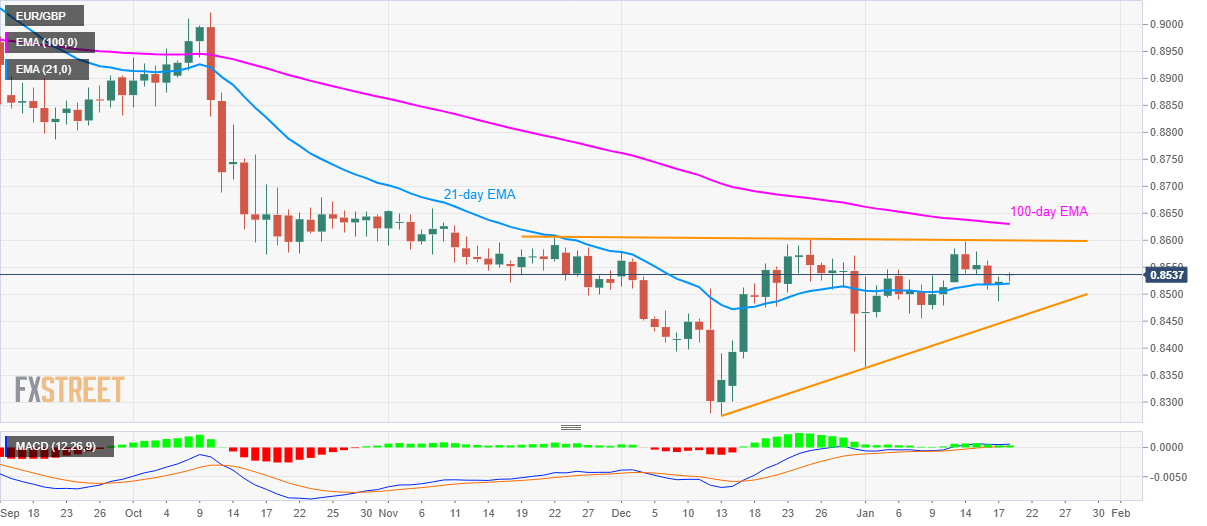
EUR/GBP takes the bids to 0.8540 while heading into the European session on Monday. The pair recently took a U-turn from 21-day EMA, amid bullish MACD, which in-turn shifts market focus to the near-term key resistance.
As a result, a downward sloping trend line since November 22, at 0.8600 now, will be important to watch. Given the pair’s daily closing beyond 0.8600, a 100-day EMA level of 0.8630 can lure the buyers.
It’s worth mentioning the 0.8570 can offer intermediate halt to the pair while November top surrounding 0.8660 and 0.8700 may please the bulls afterward.
On the flip side, pair’s declines below 21-day EMA level of 0.8520 can fetch it to the immediate support line, at 0.8450.
It should, however, be noted that the pair’s fall under 0.8450 will highlight a monthly low near 0.8365 for the bears.
EUR/GBP daily chart
Trend: Recovery expected
