- GBP/JPY stays below the support line of the nearly three-week-old ascending triangle.
- 23.6% Fibonacci retracement of the pair’s declines between December 13 and January 05 is in the spotlight.
- An upside break of 144.52/55 could favor the bulls.
GBP/JPY trades modestly changed to 143.35 during Monday’s Asian session. That said, the pair holds its break of the short-term ascending triangle formation, which in-turn signals further declines.
In doing so, 23.6% Fibonacci retracement, around 142.50 will be the key to watch as the immediate support.
Should sellers keep the reins past-142.50, 141.00 and the monthly bottom near 140.80 will offer intermediate halts to the pair’s drop towards 140.00 round-figure.
If at all prices bounce back beyond the formation support, at 143.45 now, buyers will need to justify their strength by cross 144.35/55 area including 50% Fibonacci retracement and highs marked since late-December 17.
Following the quote’s sustained run-up above 144.55, 61.8% Fibonacci retracement near 145.25 will return to the chart.
GBP/JPY four hour chart
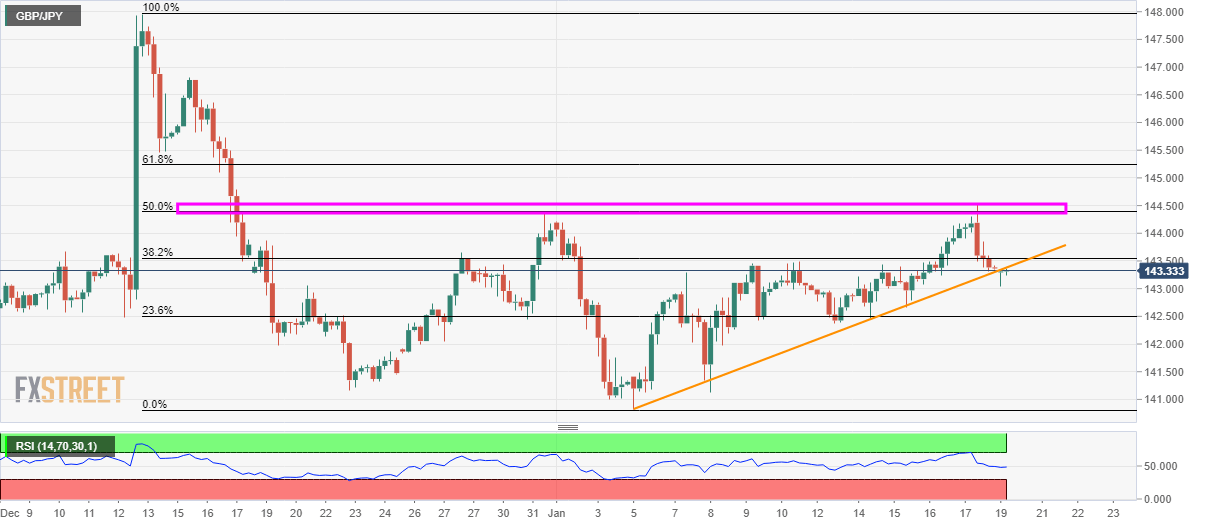
Trend: Bearish
