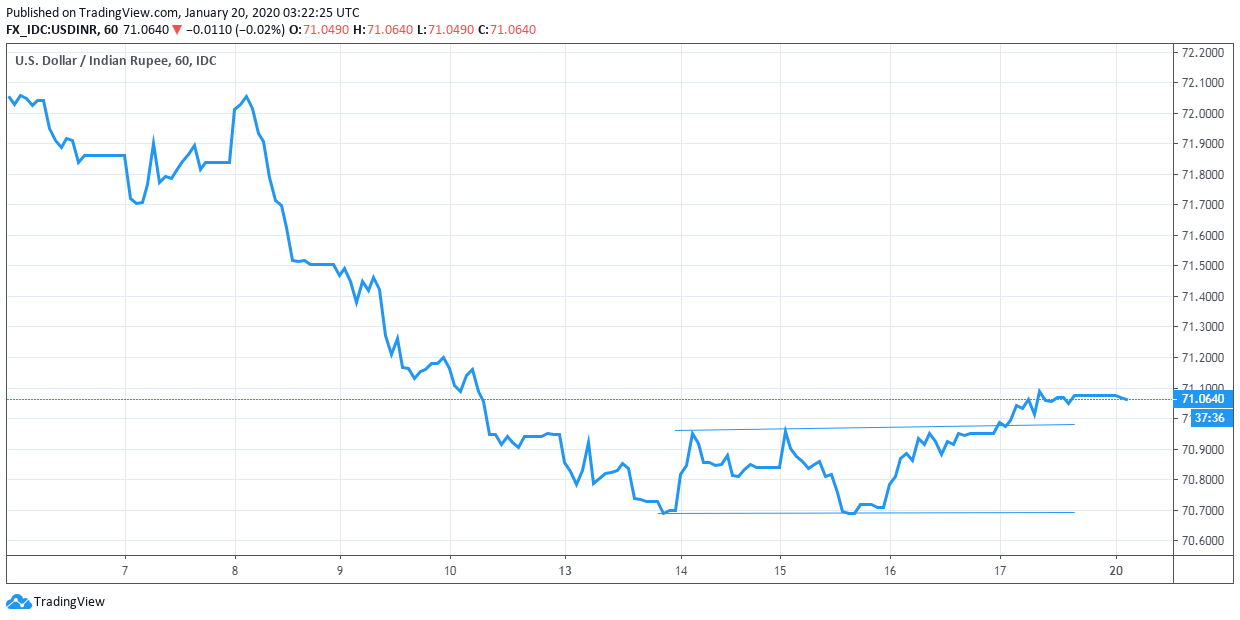
- USD/INR’s hourly chart is reporting a channel breakout.
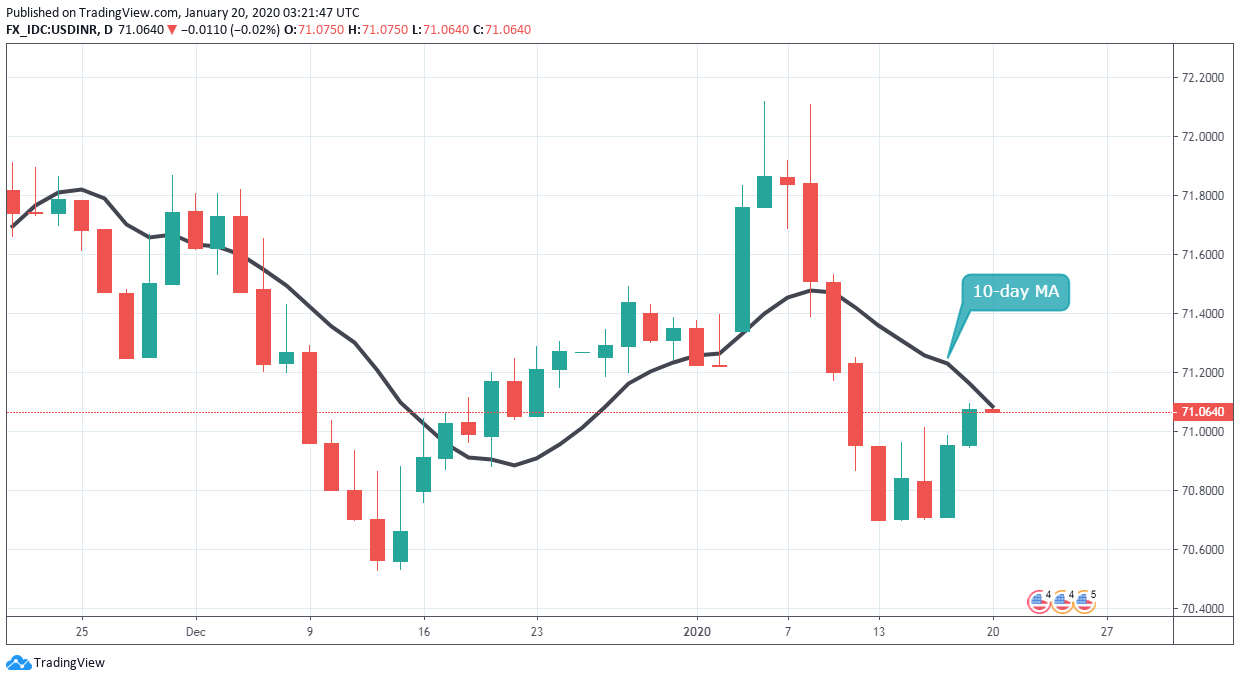
- The bulls need a sustained move above the 10-day MA.
USD/INR jumped 0.17% on Friday, confirming a sideways channel breakout on the hourly chart.
The breakout indicates the sell-off from the monthly high of 72.12 has ended. The pair, however, needs to close above the descending or bearish 10-day moving average (MA) to confirm a reversal higher.
Currently, the 10-day MA is located at 71.23. A failure to hold above the key hurdle would invalidate the breakout on the hourly chart and shift risk in favor of a re-test of 70.90. A move through that support could bring additional losses toward 70.6990 (Jan. 14 low).
Hourly chart
Daily chart
Trend: Bearish
Technical levels
