- GBP/USD struggles to hold onto recovery gains beyond the 1.3000 mark.
- December 23 low remains on the bears’ radar whereas December 31 top will challenge the buyers during upside.
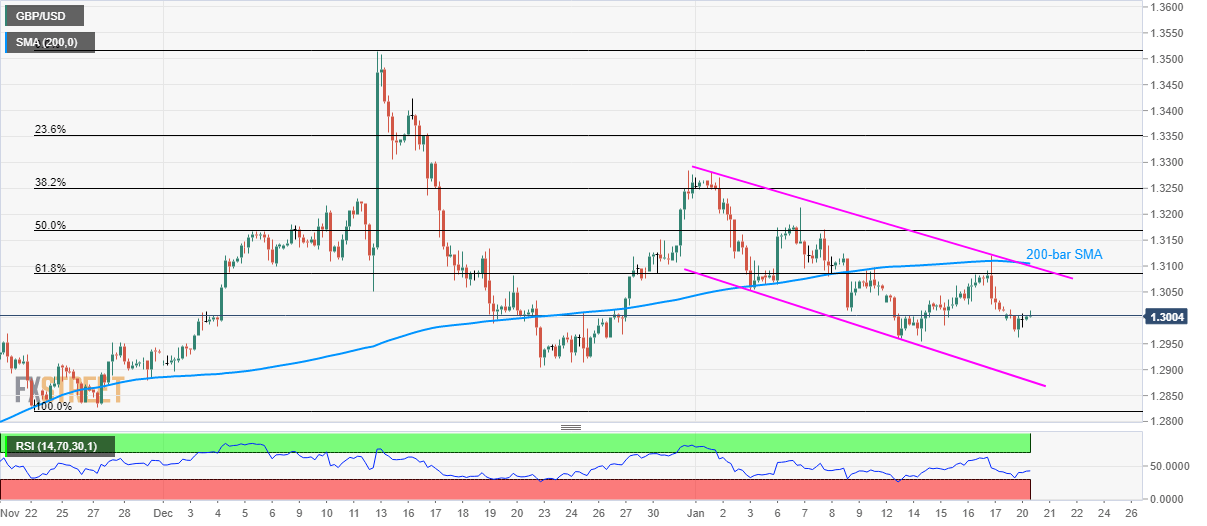
GBP/USD trades near 1.3000 by the press time of Tuesday’s Asian session. In doing so, the pair stays inside the monthly falling trend channel while also remaining below 200-bar SMA.
With this, sellers keep eyes on December 23 low, near 1.2900, as near-term key support during further declines.
In a case where GBP/USD prices remain weak below 1.2900, November 22 bottom around 1.2820 could return to the chart.
On the upside, 61.8% Fibonacci retracement of the pair’s rise from November 22 to December 12, at 1.3086, can offer immediate resistance ahead of the said channel’s upper line and 200-bar SMA confluence close to 1.3100/05.
If buyers manage to cross 1.3105, 50% Fibonacci retracement level near 1.3170 can offer intermediate halt prior to fuelling the pair towards the high marked at the end of 2019, at 1.3285.
GBP/USD four-hour chart
Trend: Bearish
