- Gold prices register three-day-winning streak, regains its place above 10-day SMA.
- January 06 high can question the bullion’s rise beyond $1,572,73 supply-zone.
- Monthly low, 50% Fibonacci retracement could challenge the bears.
Following its sustained bounce off 10-day SMA, Gold prices seesaw near $1,560/61 during Tuesday’s Asian session.
The yellow metal now heads to 23.6% Fibonacci retracement of its rise between November 12 and January 08, around 1,572/73, a break of which could propel the quote towards January 06 top surrounding $1,587.
Should there be increased buying past-$1,587, $1,600 and the monthly top of $1,611.30 could lure the bulls.
On the downside break of 10-day SMA, at 1,555 now, 38.2% Fibonacci retracement near $1,548 can entertain sellers ahead of pushing them to the monthly bottom of $1,536.
During the precious metal’s extended declines below $1,536, 50% Fibonacci retracement level of $1,528 seems to gain the bear’s attention.
Gold daily chart
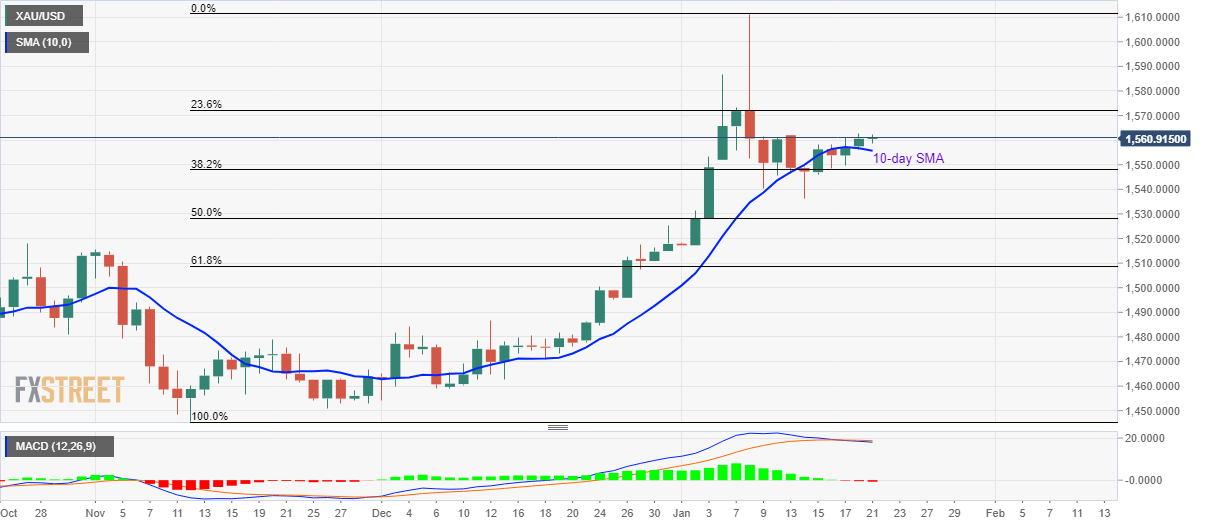
Trend: Further recovery expected
