- The inverse head-and-shoulders pattern can lead to more upside.
- Upside targets can be located near 97.85 and 98.20 levels.
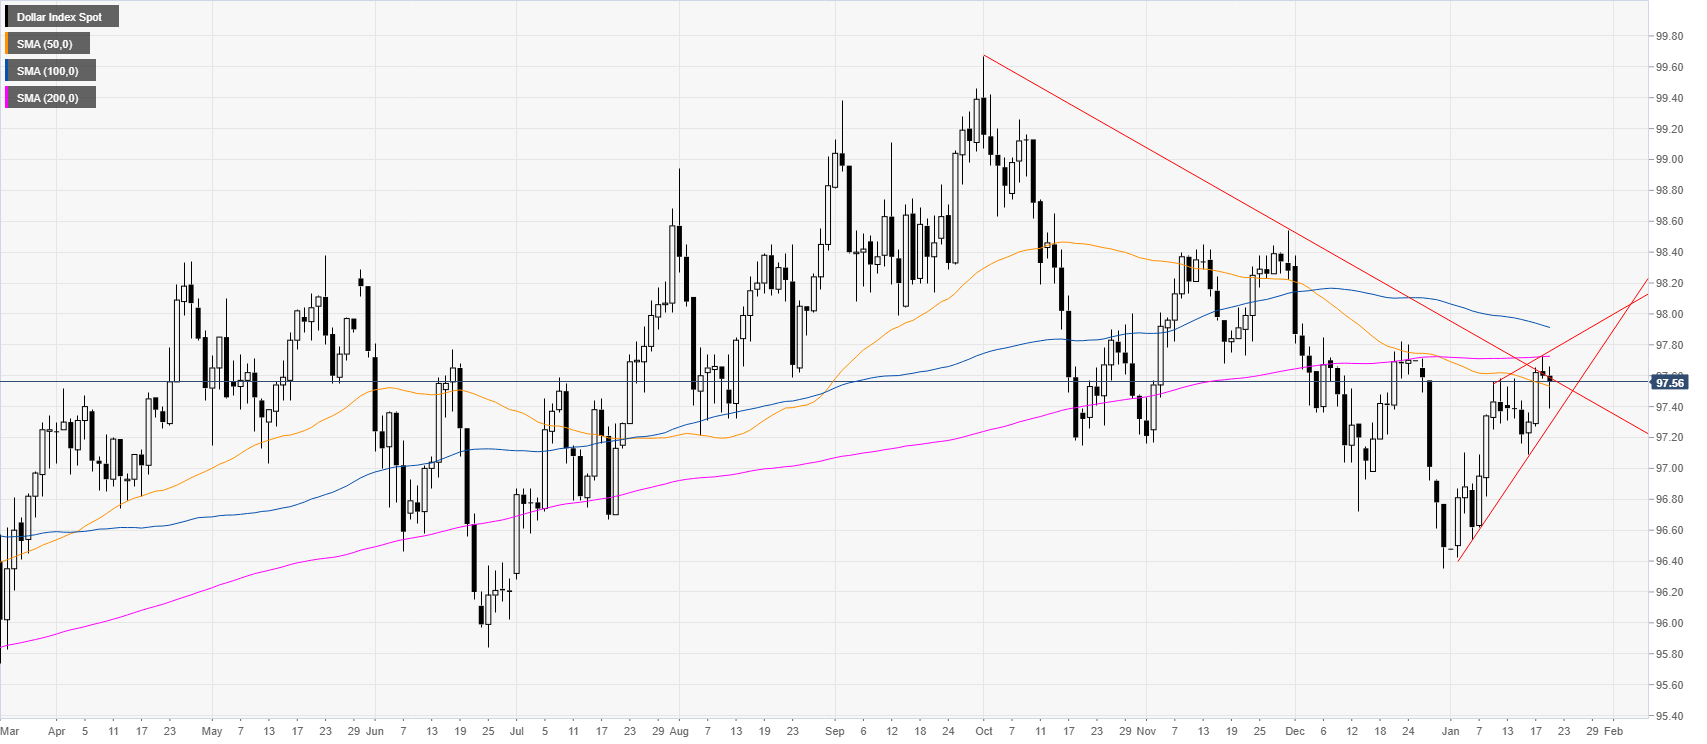
DXY daily chart
The US Dollar Index (DXY) is trading between the 50 and 200-day simple moving average (SMA). DXY is also trading within a rising wedge channel.
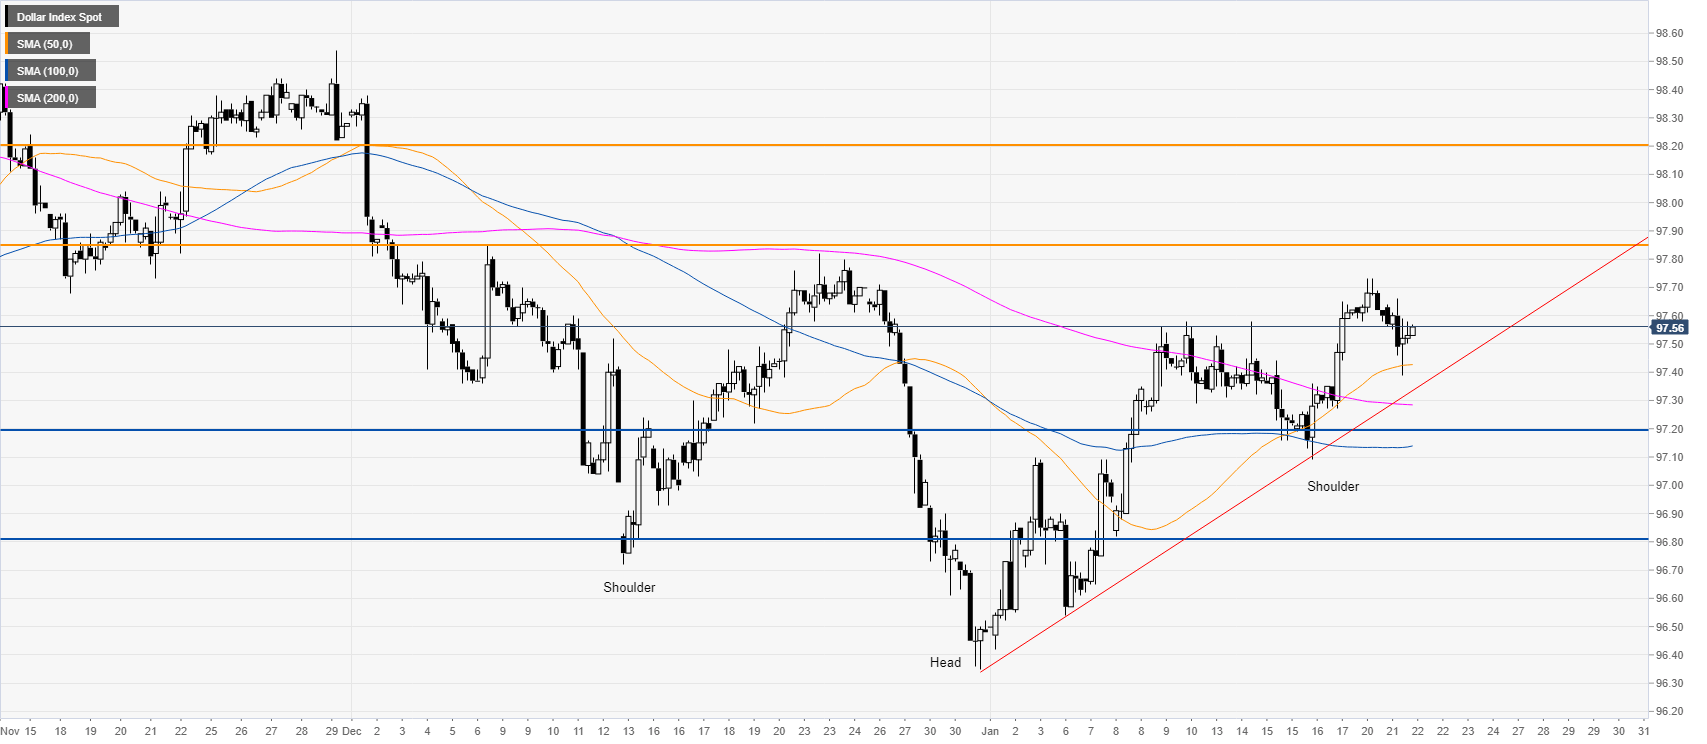
DXY four-hour chart
DXY is trading above the main simple moving averages (SMAs) and a rising trendline, suggesting a bullish bias in the medium term. The greenback is also in an inverted head-and-shoulder pattern and the market could stay bullish while above the right shoulder and the 97.20/10 support zone. If buyers decide to lift the market they could reach the 97.85 and 98.20 to the upside.
Additional key levels
