- USD/INR buyers are eying the 72.00 handle.
- The level to beat for bulls is the 71.20 resistance.
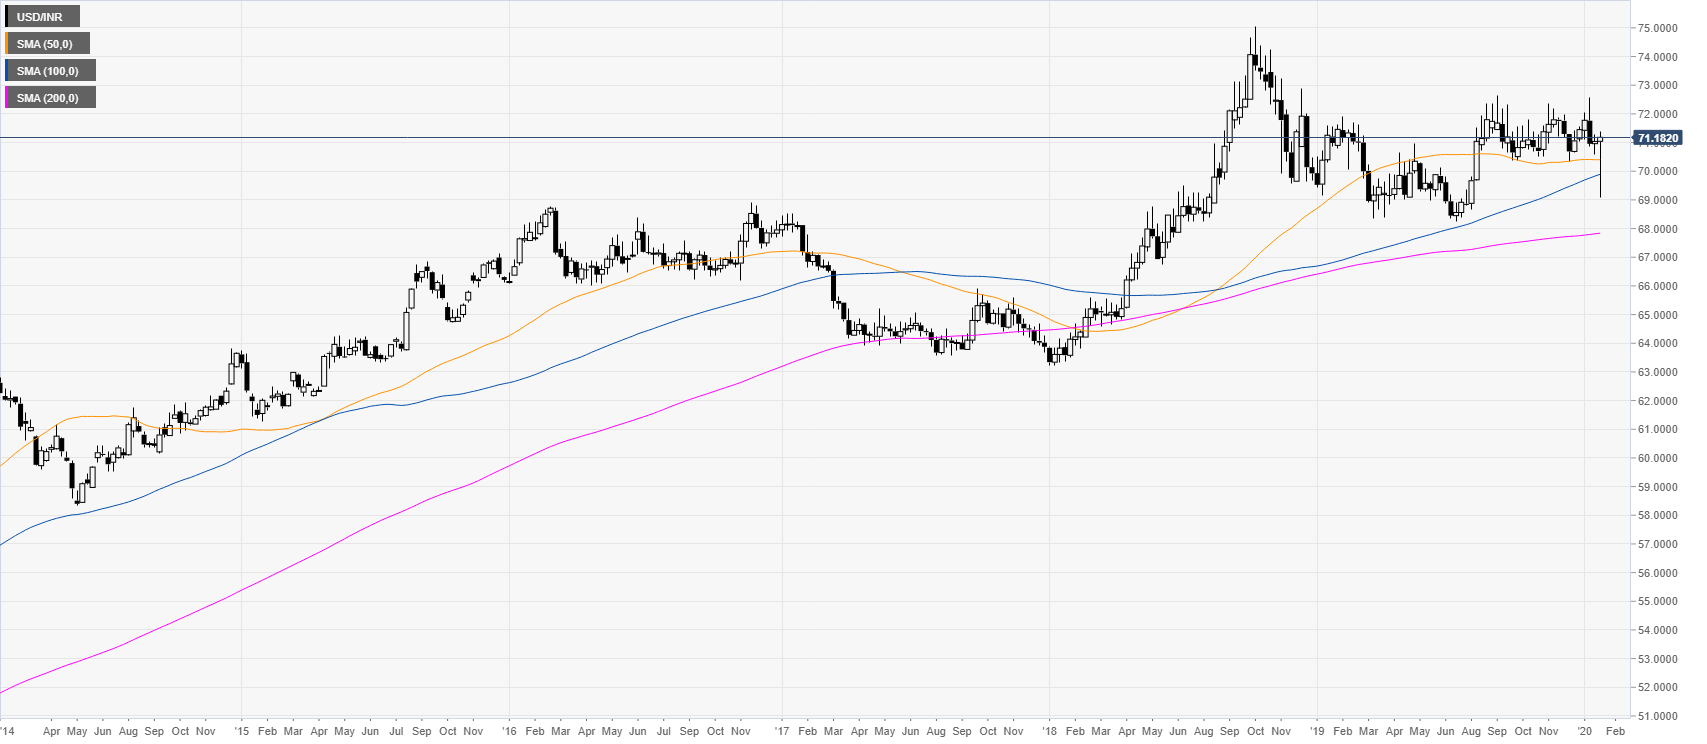
USD/INR weekly chart
USD/INR is trading in a rectangle consolidation while holding above the main weekly simple moving averages (SMAs).
USD/INR daily chart
The market is ranging in a rectangle formation while in the 70.40-72.40 range as it is holding above the 200-day simple moving average (SMA). As the market is rejecting the 70.40 -69.40 support zone and reversing from the lows, the spot could extend its rise after a break of the 71.20 resistance and potentially target 71.60, 72.00 and 72.40 levels
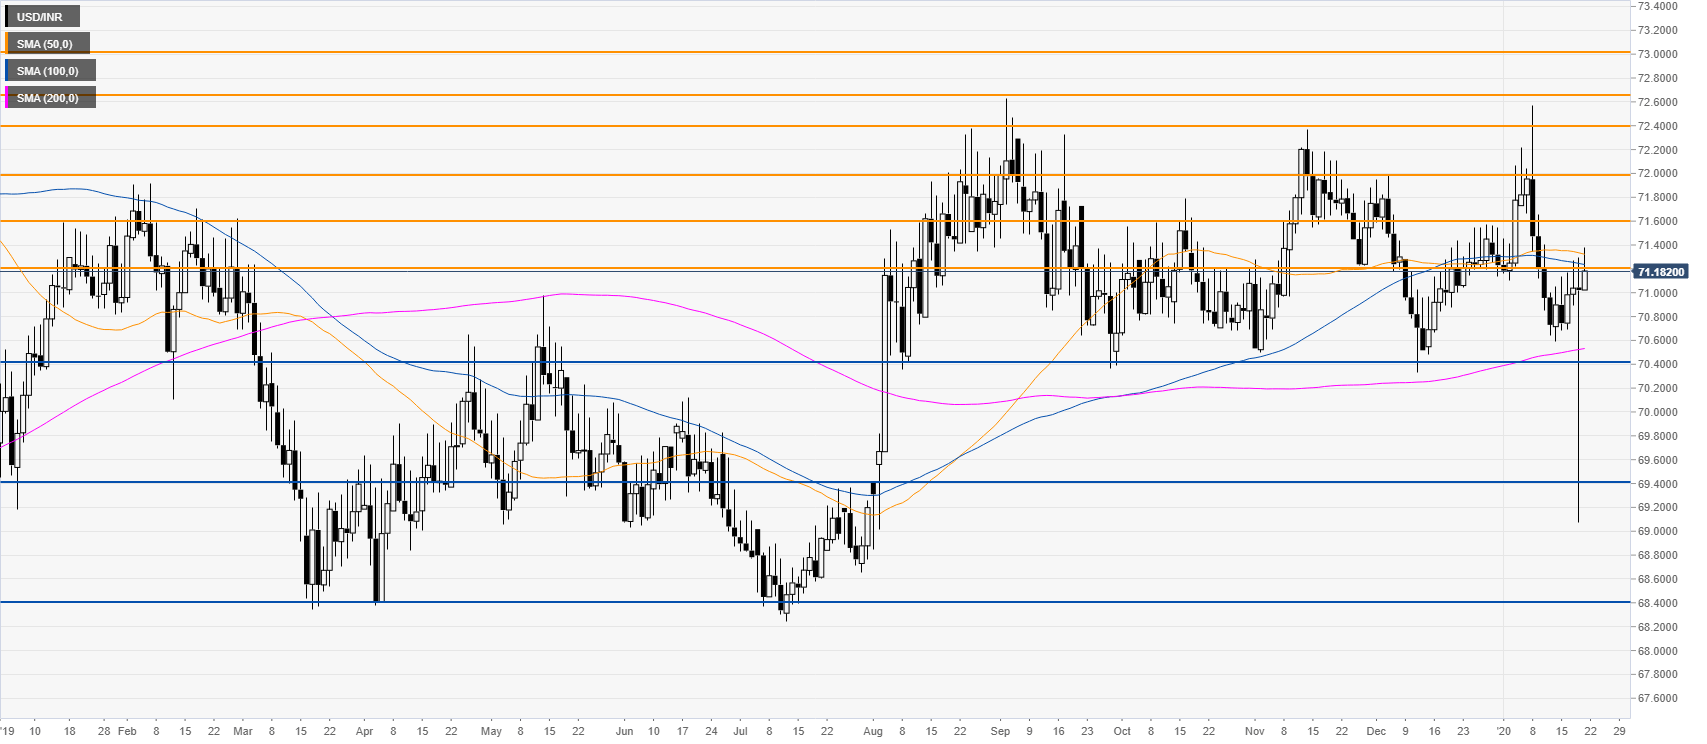
Additional key levels
