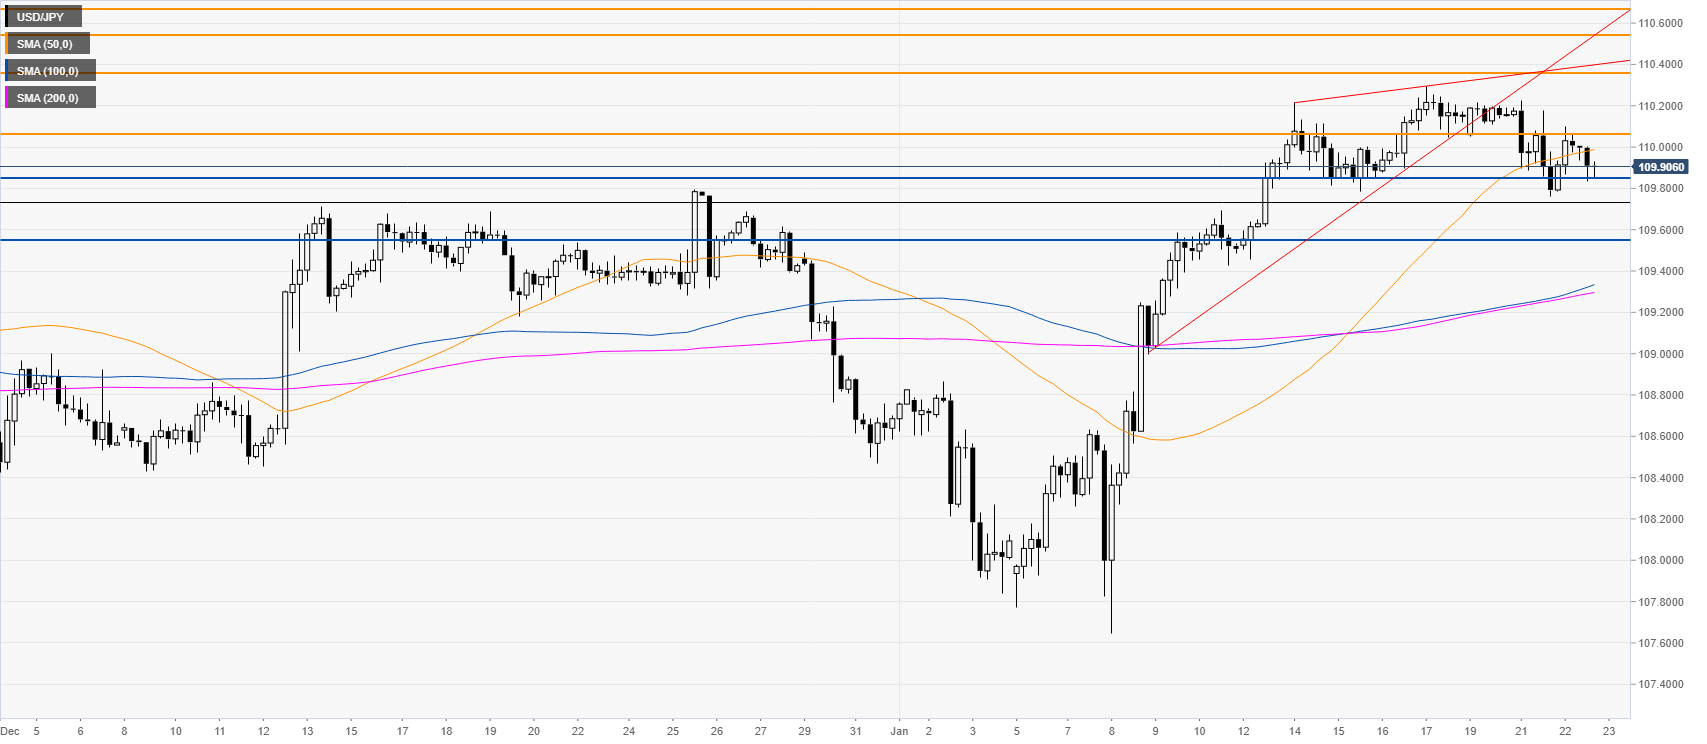
- USD/JPY is breaking down from a rising wedge pattern.
- USD/JPY is set to decline to the 109.55 level.
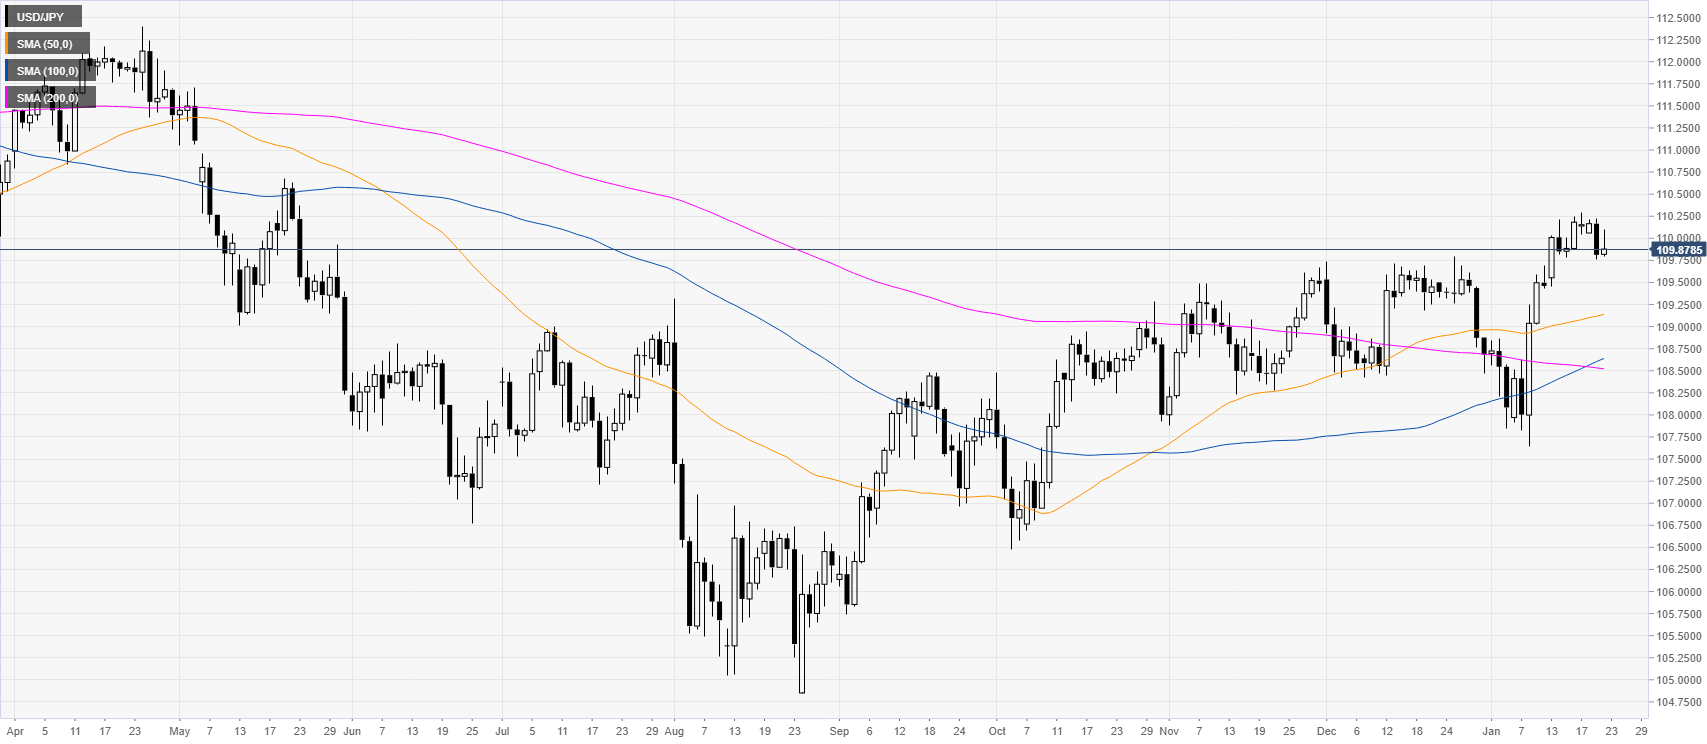
USD/JPY daily chart
USD/JPY is retracing down after the January spike near the 110.00 figure above the main simple moving averages (SMAs). The spot is pulling back down from its highest point since mid-May 2019.
USD/JPY four-hour chart
USD/JPY is breaking down from a rising wedge formation while trading above the 100/200 SMAs. Sellers are putting the 109.85 support under pressure below the 50 SMA. If the 109.85 level is taken out, the sellers could lead the market down to the 109.55 level, according to the Technical Confluences Indicator. Resistance is seen at the 110.05 level.
Additional key levels
