- The triangle bullish breakout is failing.
- The level to beat for bears is the 1.3060 level.
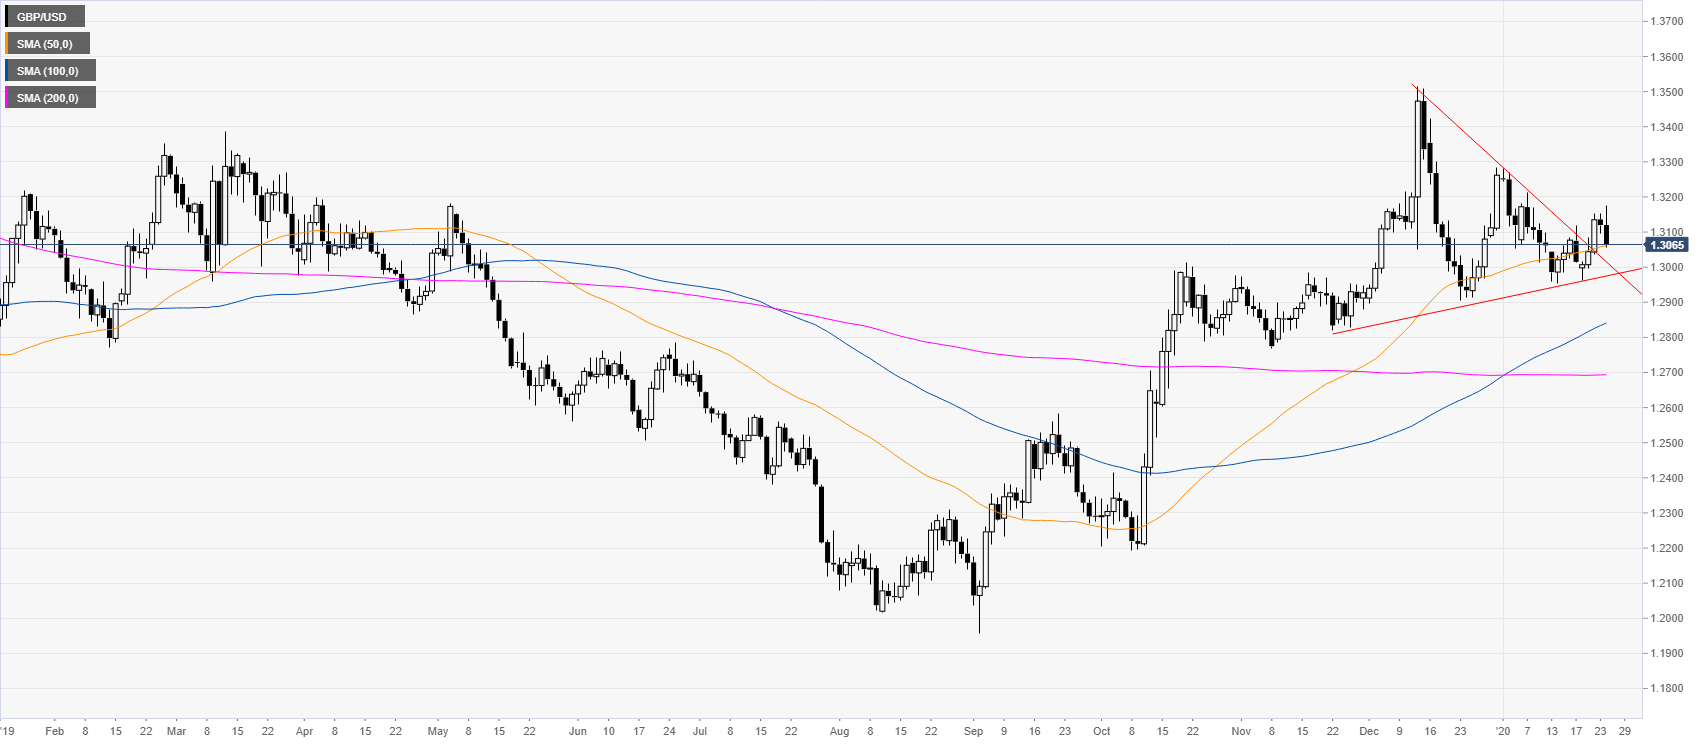
GBP/USD daily chart
The break from the triangle pattern is currently failing below the 1.3100 figure. The market is challenging the 50-day simple moving average (SMA).
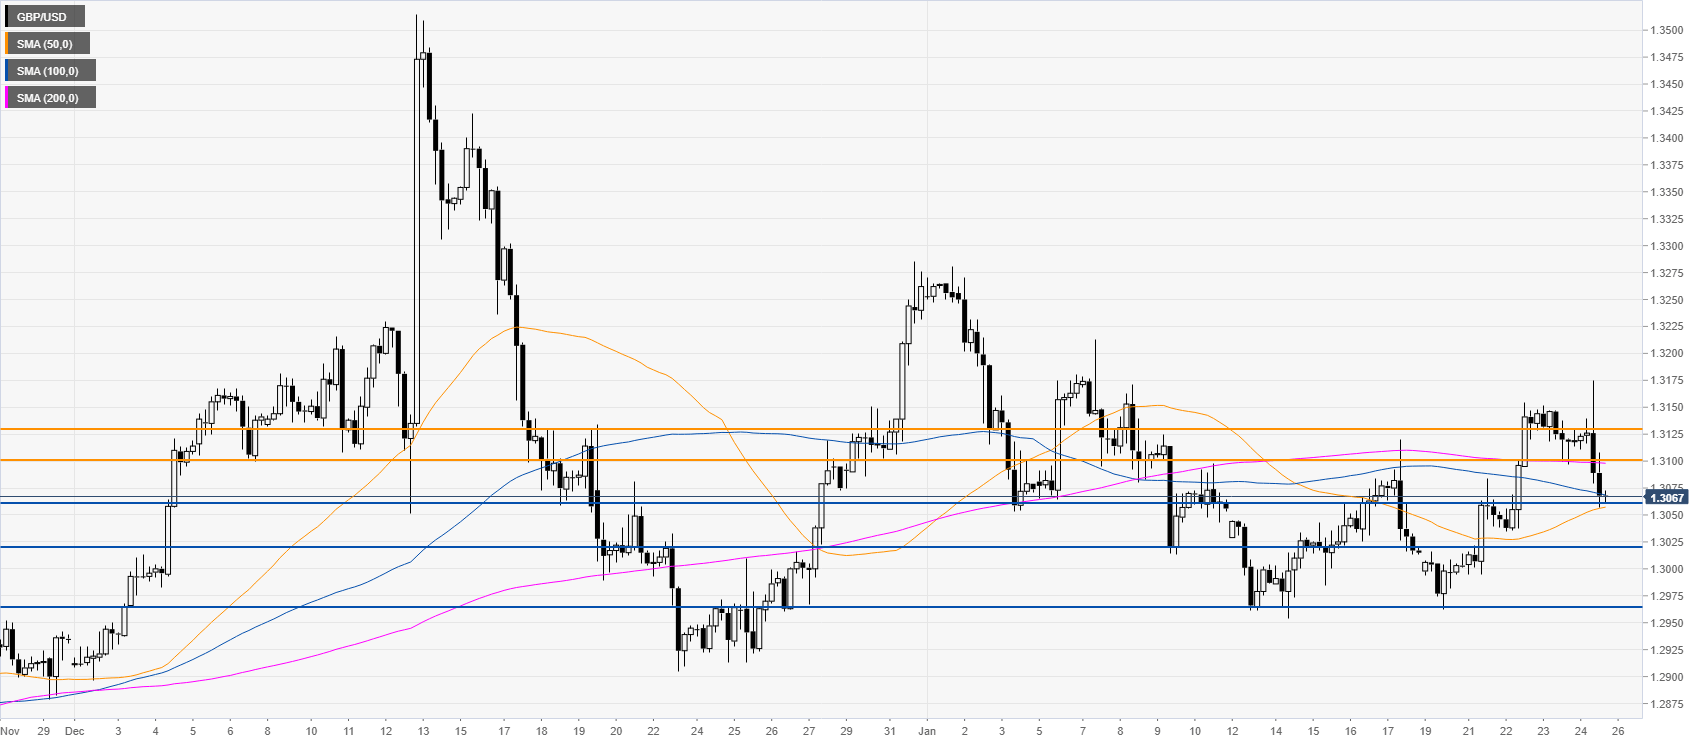
GBP/USD four-hour chart
The pound is breaking down after rejecting the 1.3100 figure. The market is challenging the 1.3060 support and the 50/10 /SMAs. A breach below this level could lead to further downside with bears setting their eyes on the 1.3019 and 1.2965 resistances, according to the Technical Confluences Indicator.
Additional key levels
