- Last Friday’s spike is easing below the 1.1100 figure.
- The level to beat for bears is the 1.1060 support.
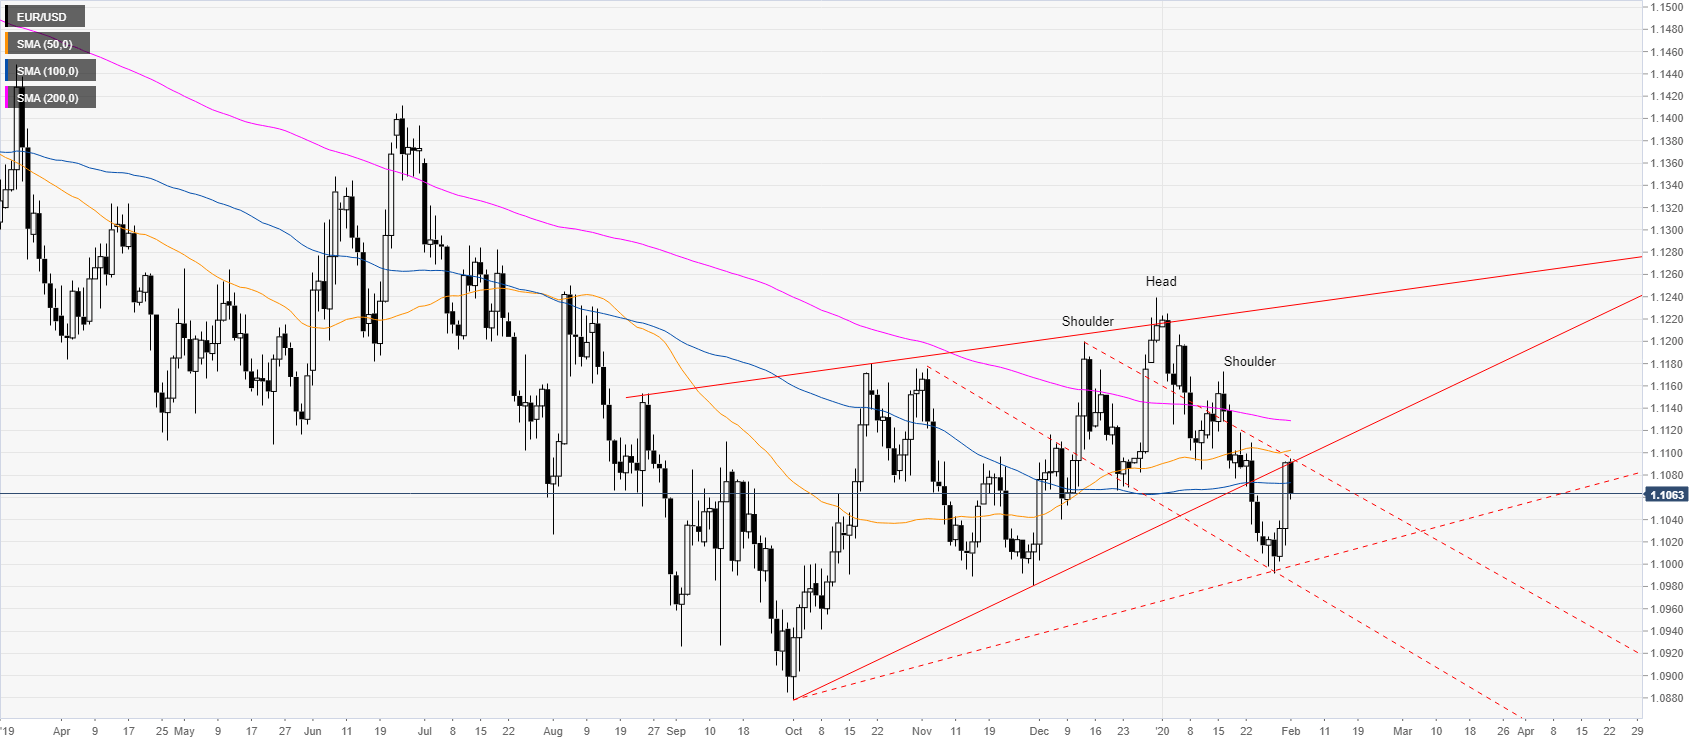
EUR/USD daily chart
EUR/USD is trading in a weak bear trend below the main simple moving averages (SMAs) as the market broke below an ascending trendline and is now testing as the market is bouncing. The spot remains weak below the 200 SMA/1.1200 zone and is more likely to enter a triangle consolidation in the next sessions.
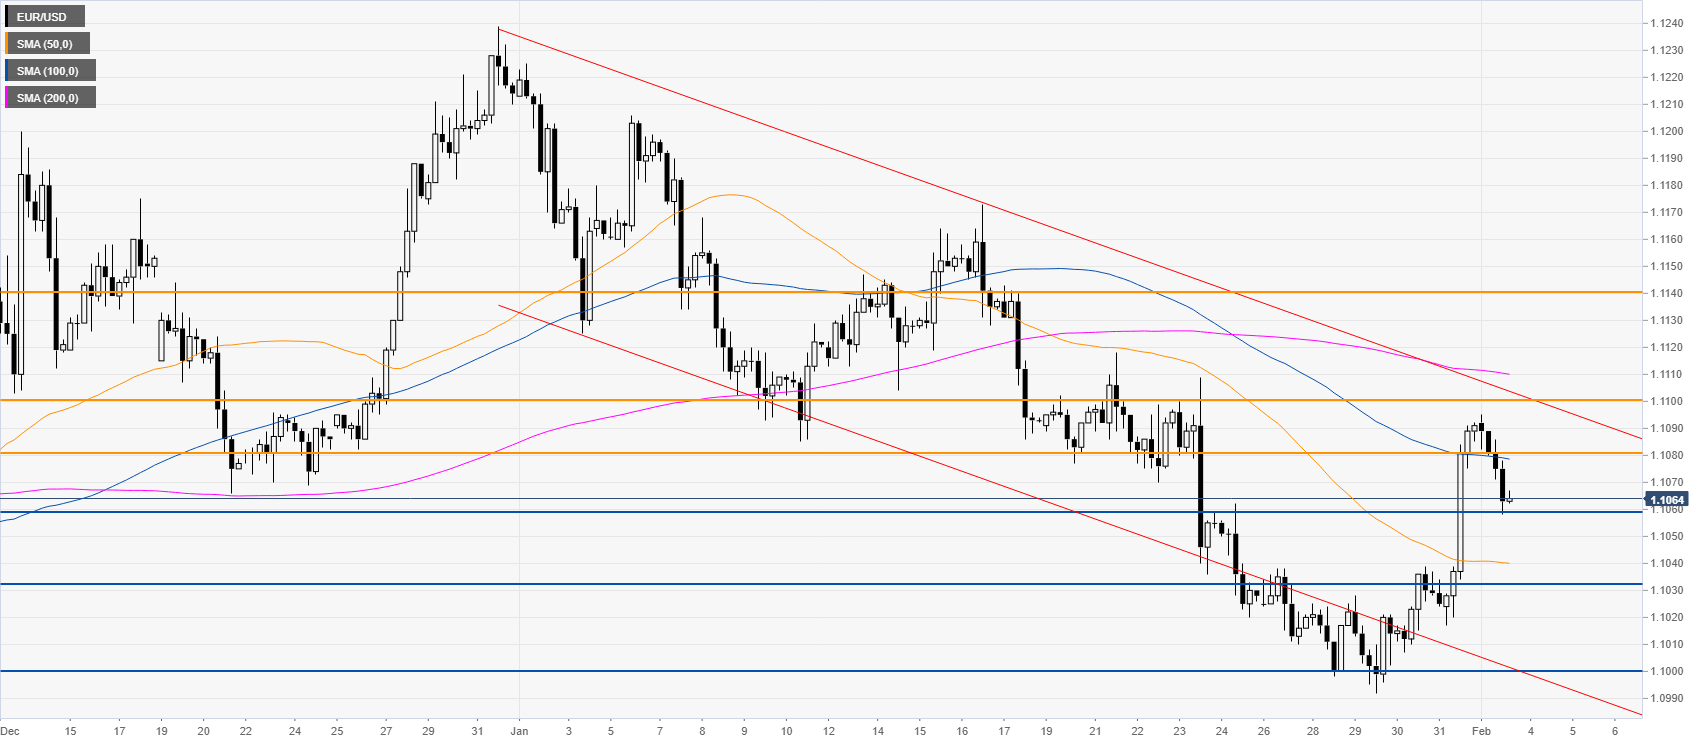
EUR/USD four-hour chart
EUR/USD is trading in a descending channel below the 100/200 SMAs. The spot challenged the 1.1100 resistance and is now easing. A break below the 1.1060 support can see 1.1033 and 1.1000 figure revisited. On the flip, side a break above the 1.1100/1.1140 resistance zone would question the bear’s commitment, according to the Technical Confluences Indicator.
Support: 1.1060, 1.1033, 1.1000
Resistance: 1.1080, 1.1100, 1.1140
Additional key levels


