- USD/JPY remains bearish forming lower lows and lower highs
- The level to beat is the 108.30 support.
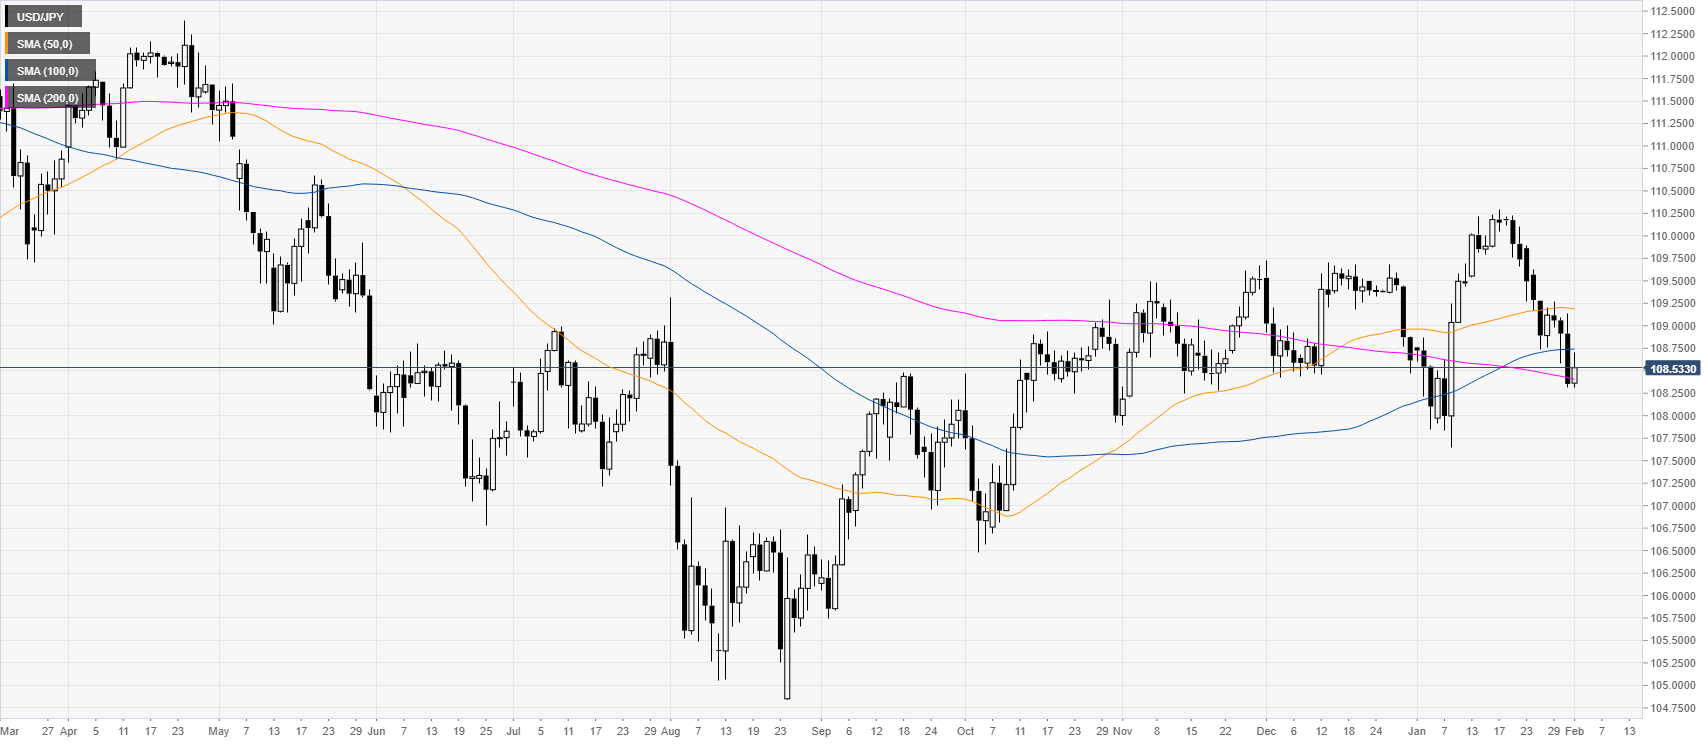
USD/JPY daily chart
USD/JPY erased almost all the gains made in the month of January. The spot is challenging the 200-day simple moving averages (SMA) while below the 109.00 figure
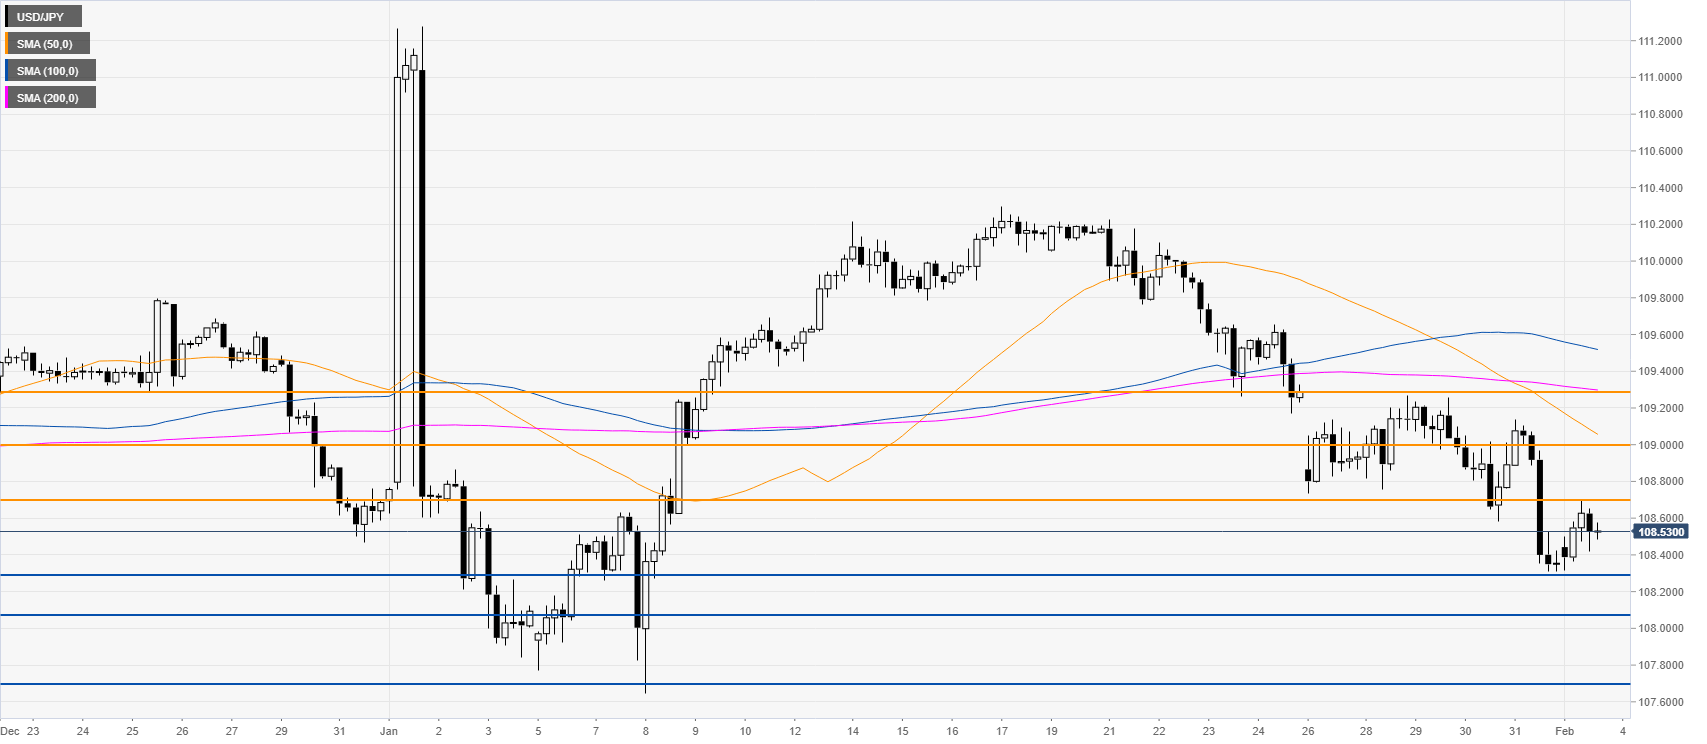
USD/JPY four-hour chart
USD/JPY is grinding lower below the main simple moving averages (SMAs) while making lower lows and lower highs. As the market is weak, a break below the 108.30 level can expose the 108.10 and 107.69 support levels, according to the Technical Confluences Indicator. On the flip side, bullish attempts could find resistance near 108.71, 109.00 and 109.30 levels.
Resistance 108.71, 109.00, 109.30
Support 108.30, 108.10, 107.69
Additional key levels


