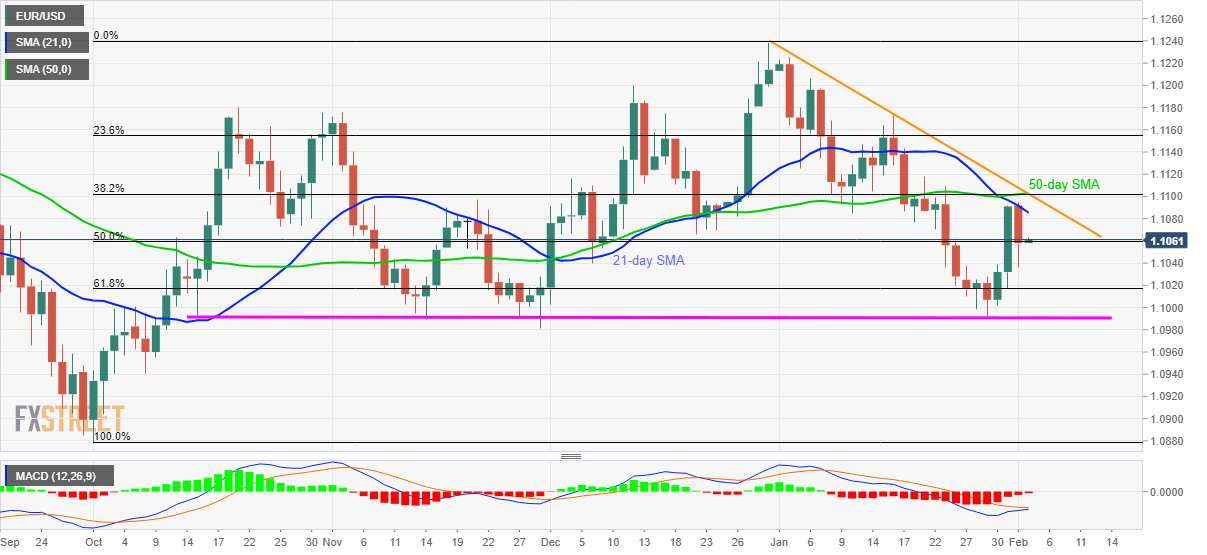
- EUR/USD remains below 21-day SMA, nears 50% Fibonacci retracement.
- A confluence of 50-day SMA, 38.2% Fibonacci retracement and five-week-old descending trend line offers the key resistance.
- 61.8% Fibonacci retracement, 1.0990/95 can please sellers during further declines.
EUR/USD recovers the previous day’s losses while trading around 1.1060 during early Tuesday. The pair recently took a U-turn from 21-day SMA but failed to stay longer below 50% Fibonacci retracement of its October-December 2019 upside.
With this, prices are likely to again challenge 21-day SMA level of 1.1085. However, 50-day SMA, 38.2% Fibonacci retracement and a short-term falling resistance line could keep challenging the buyers around 1.1100/05.
In a case where prices manage to provide a daily closing beyond 1.1105, January 16 high near 1.1175 and 1.1200/05 can offer intermediate halts during the run-up to December 2019 monthly top close to 1.1240.
Alternatively, 61.8% Fibonacci retracement near 1.1017, followed multi-week-old horizontal support around 1.0995/90, can limit the pair’s further declines.
EUR/USD daily chart
Trend: Pullback expected

